Filter Actions
Filter Actions
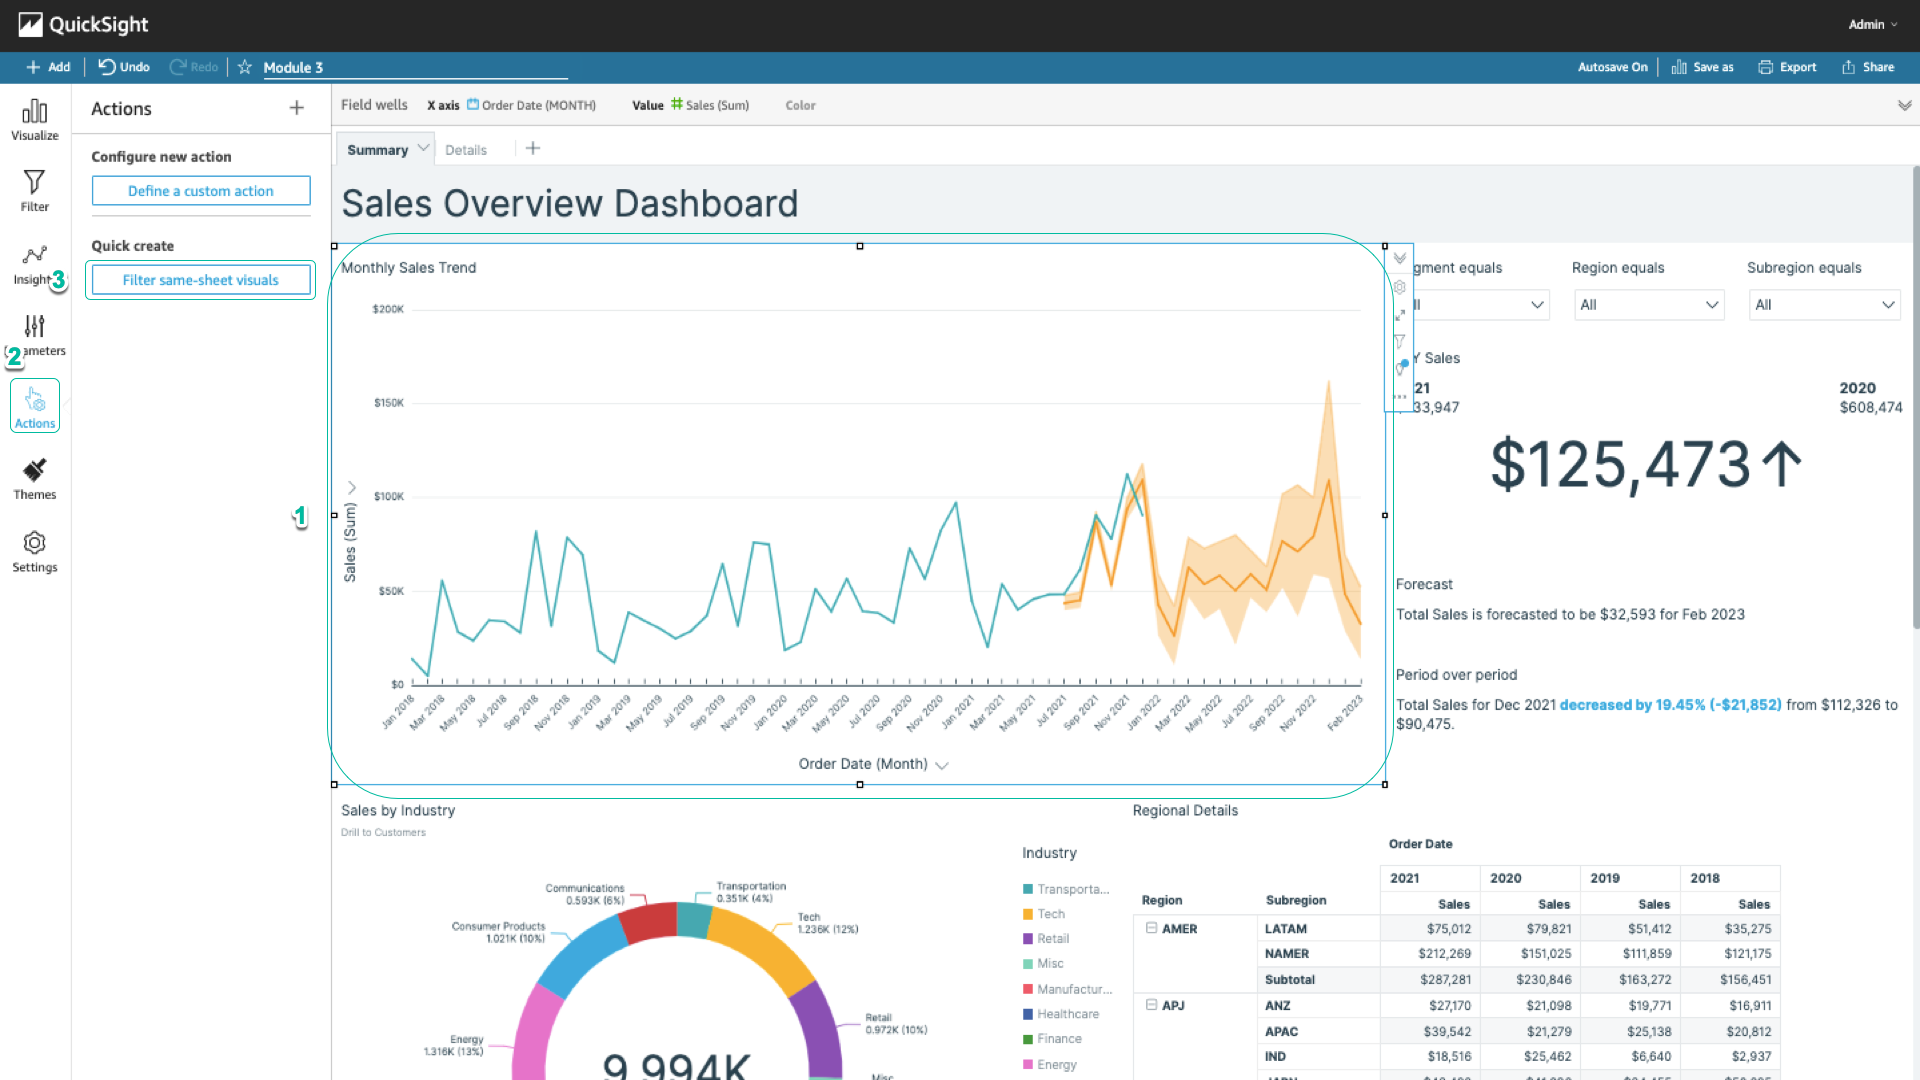
Filter Actions allows you to perform actions that filter the charts or the entire dashboard page depending on the selection made in a given chart. This is a way to allow you to ask more follow-up questions by drilling into the data by filter. Although we applied the simple Action filter feature while building the dashboard, in this section we will practice some of the more complex options for actions..
- Select the original chart. In this case, it’s a line chart. In the left navigation bar, select Actions > Filter same sheet visuals.
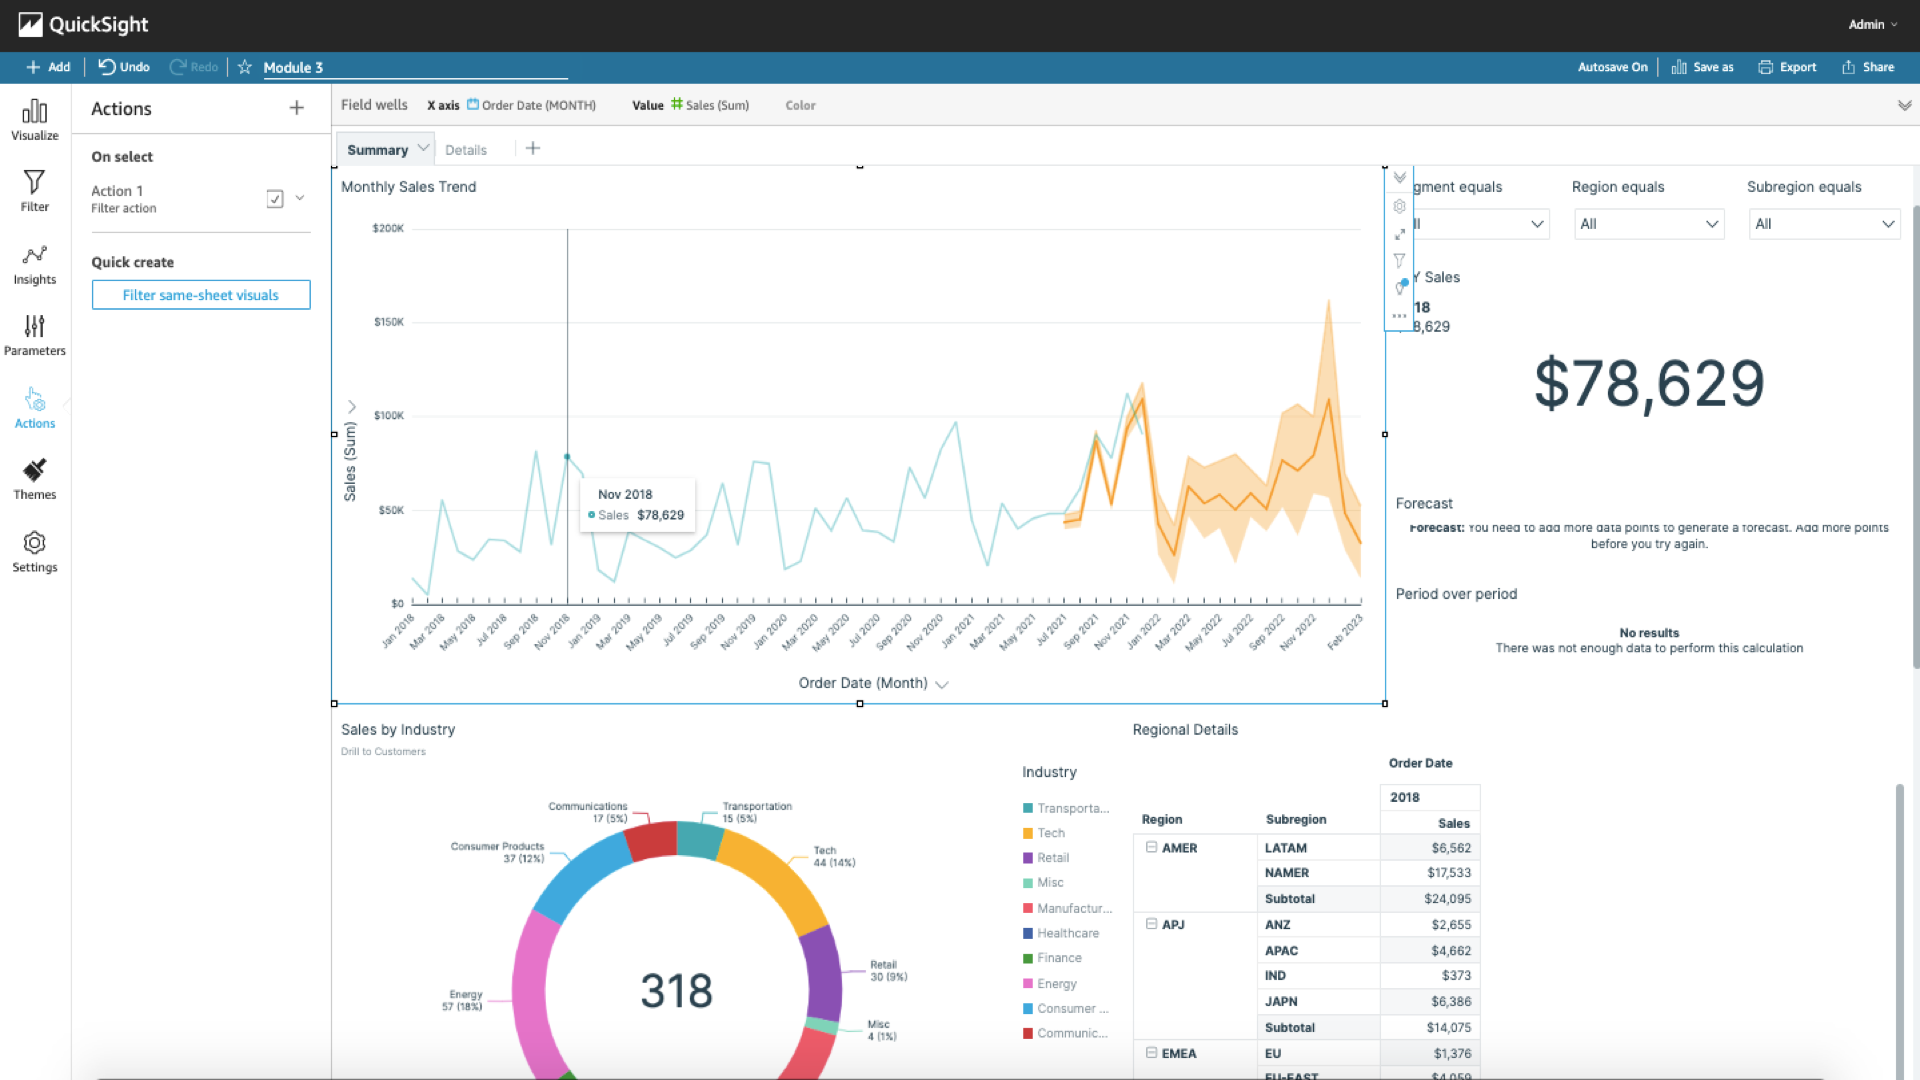
When a data point is selected, the histograms are filtered by the period of that data. You can see the Forecast and Period over period chart affected. The following steps will help keep these two graphs from being affected by filtering:
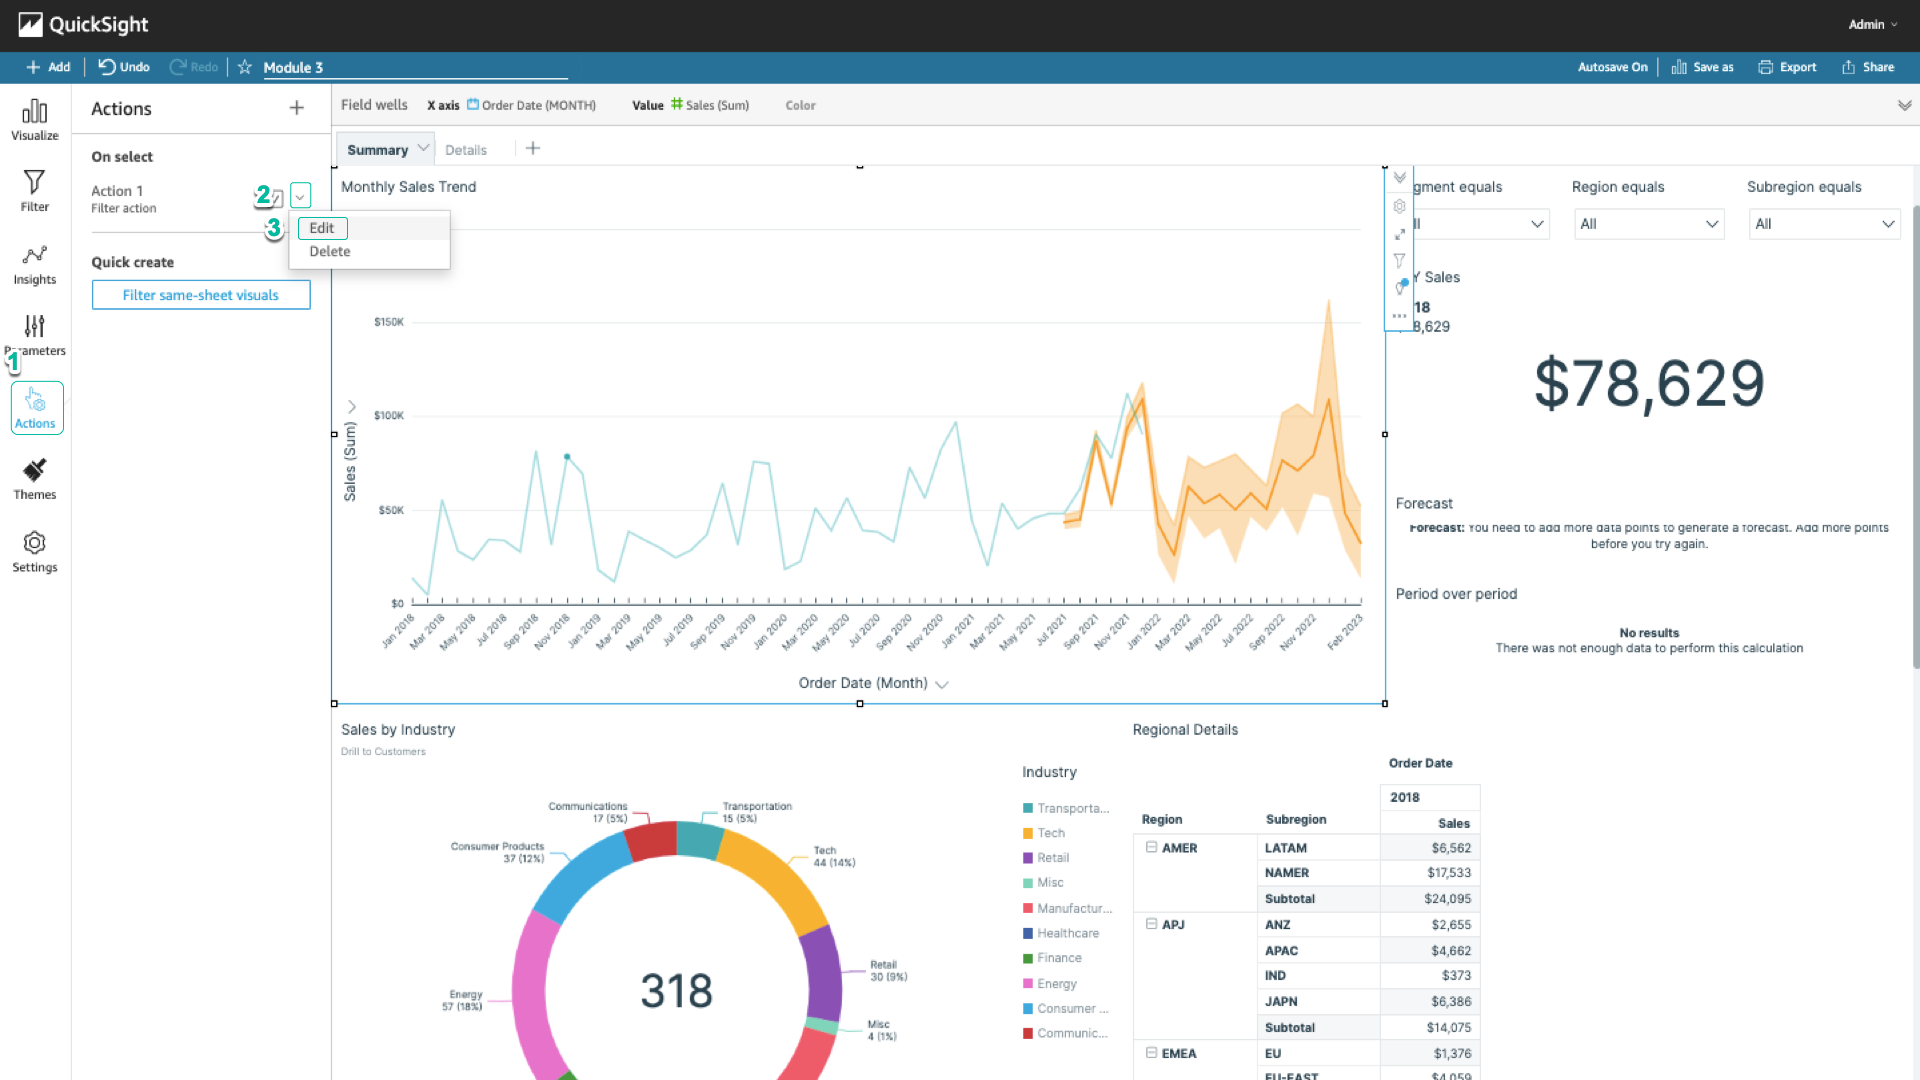
- In the left navigation bar, select Actions. Select the arrow to the right of the filter, and select Edit
- Under Target visuals, select Select visuals, and uncheck Period over period and Forecast. Select Save.
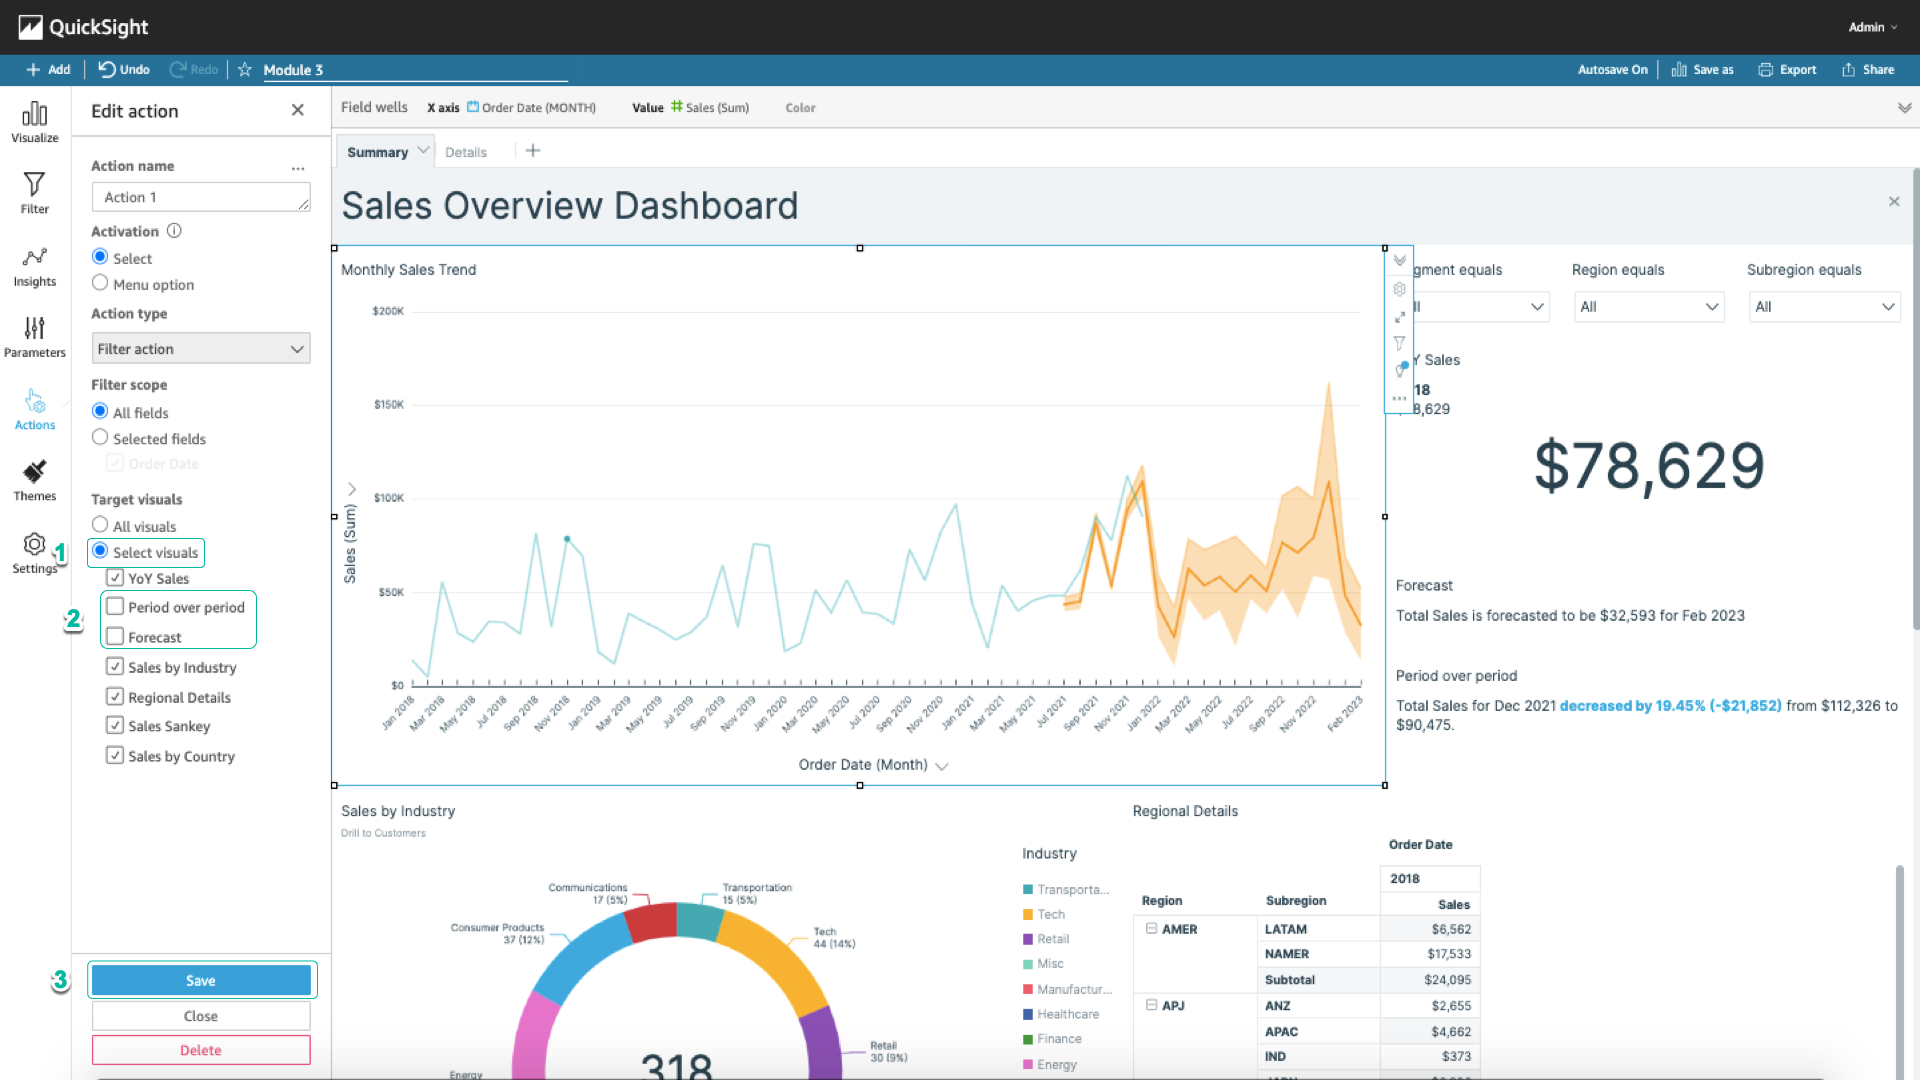
Now when you select a data point, all charts are active.