Pie chart
Content
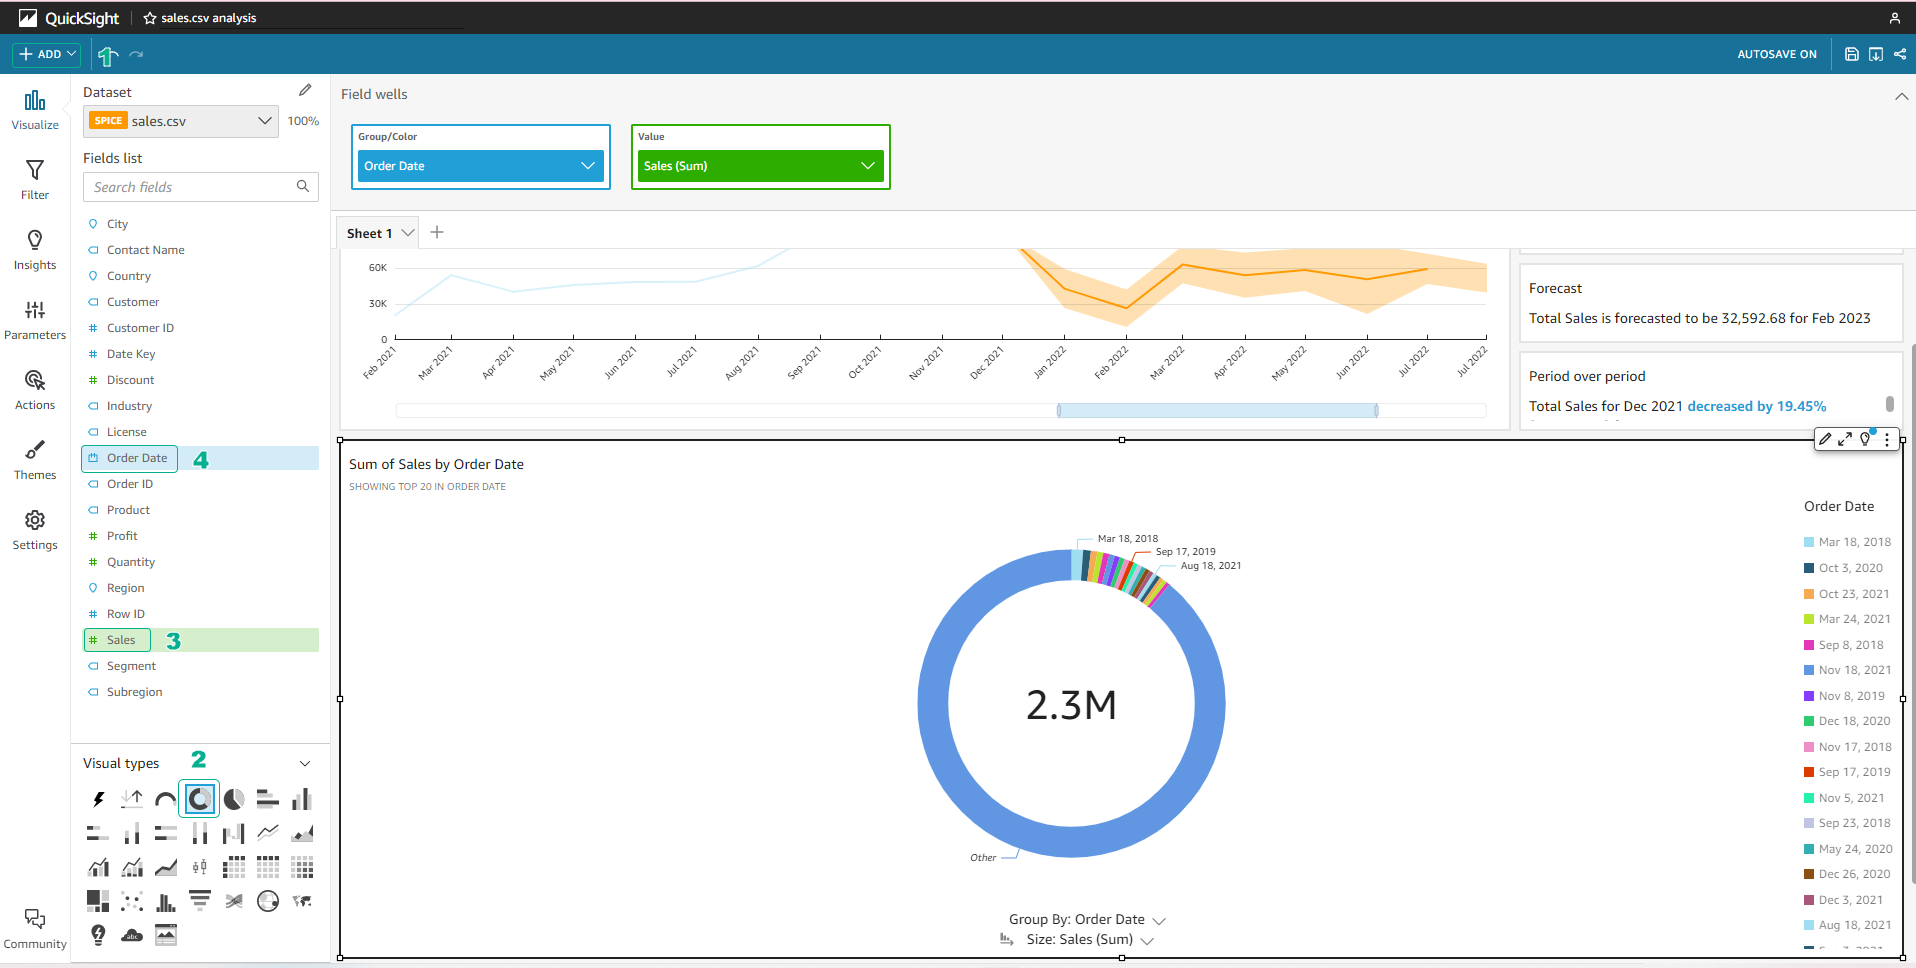
Create a chart
- Select Add > Add visual.
- In the section Visual types on the left corner, select Donut chart.
- In the Fields list, select Sales and Order date.
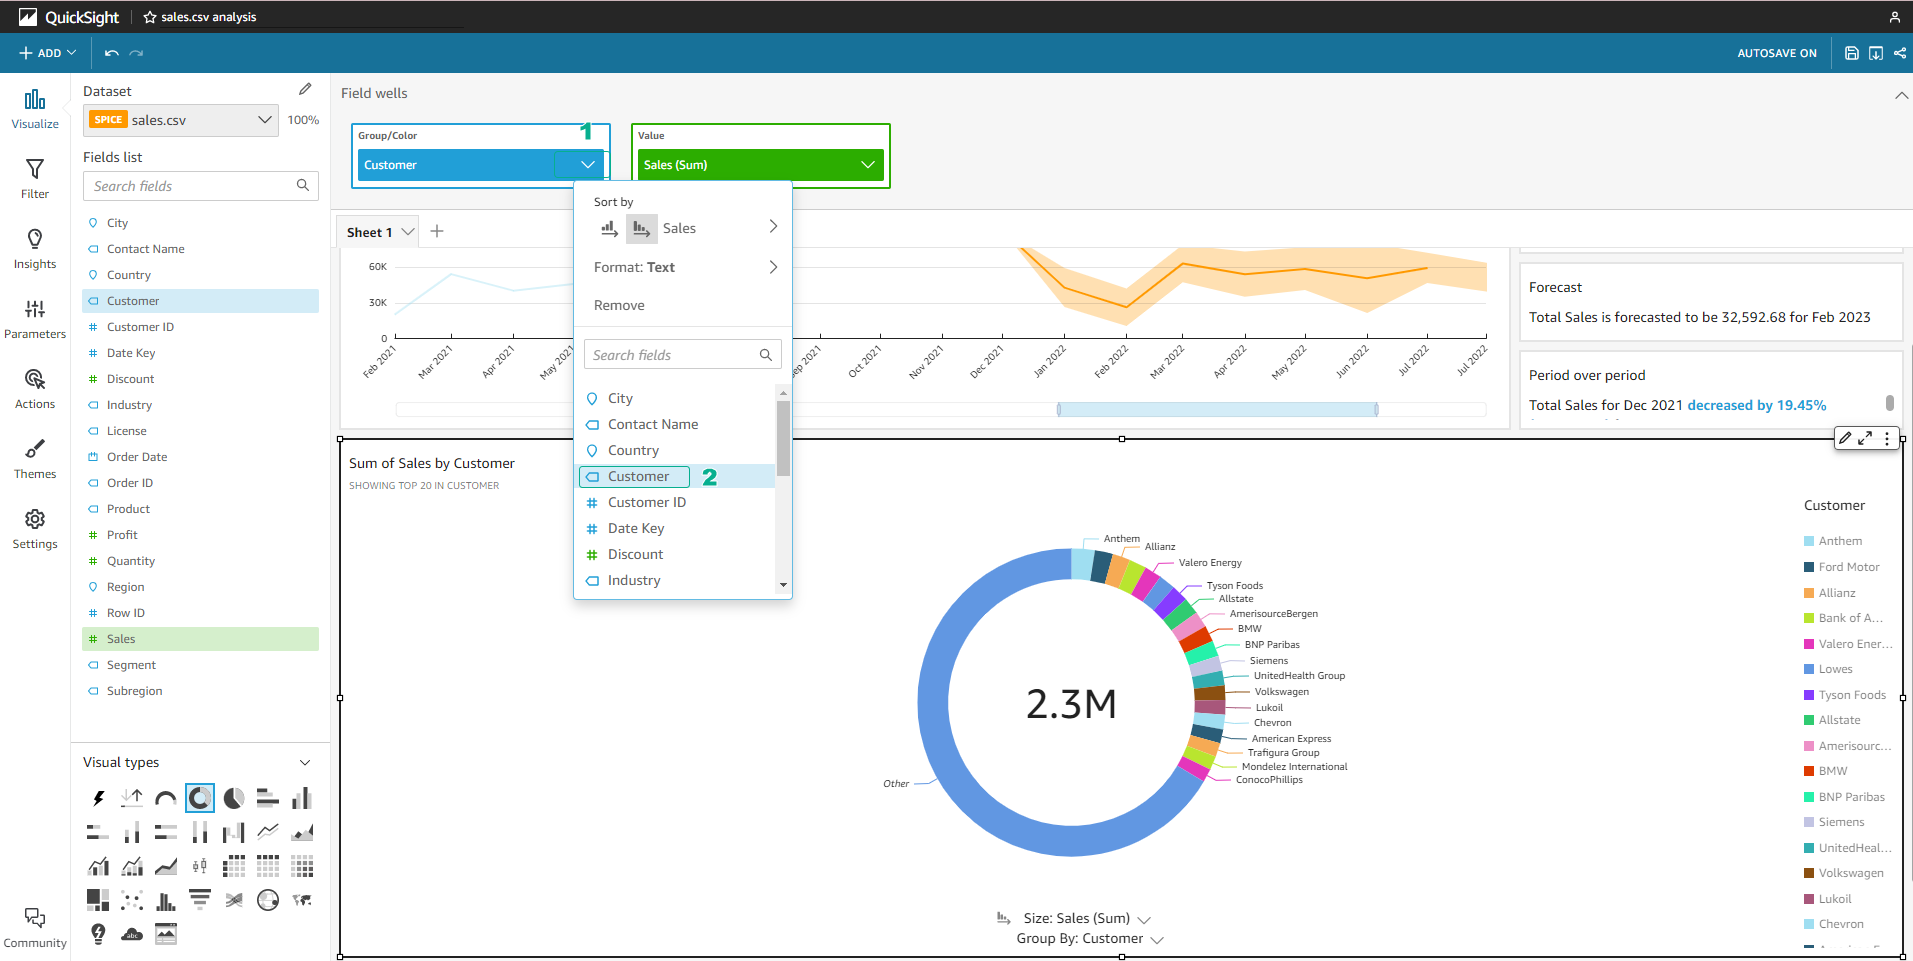
Add Drill-down Layer
You can add details related to data by adding Drill-down layers.
-
Drag and drop the item Customer from the Fields list into the Group/Color section. Hold this field and release the mouse when you see the Add drill-down layer message.
-
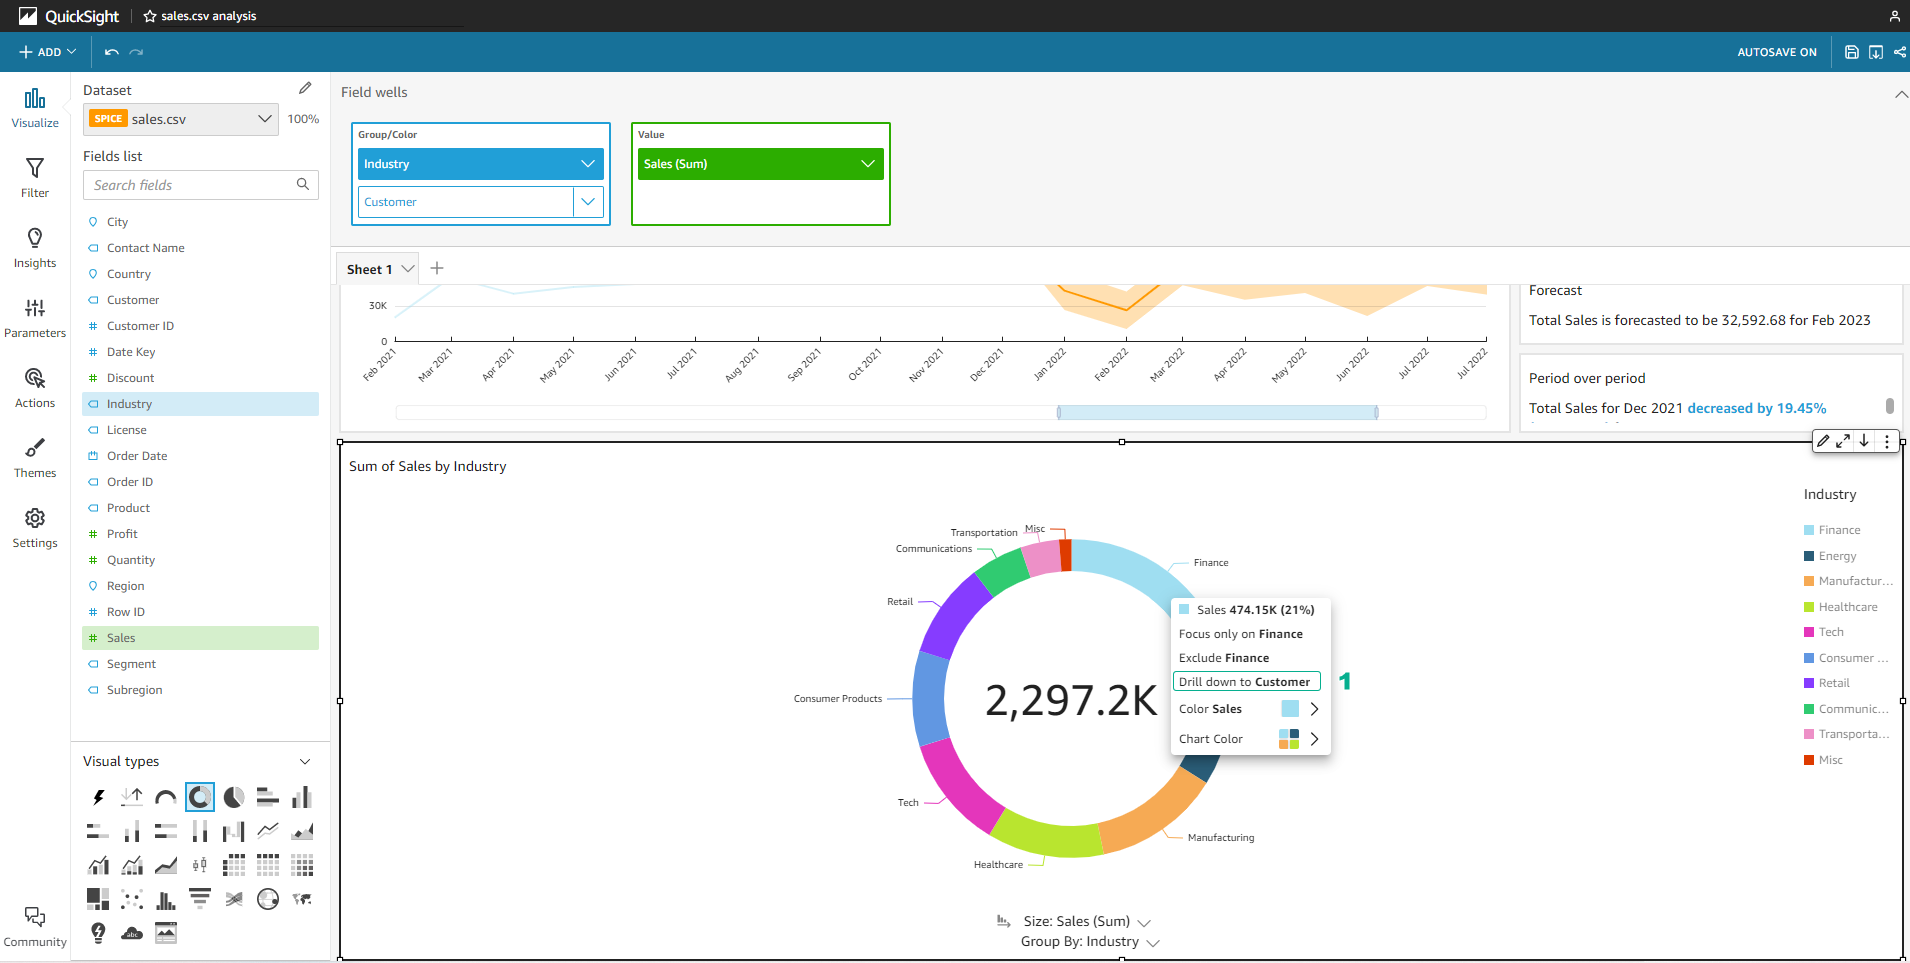
Right-click on any Industry unit (eg Finance).
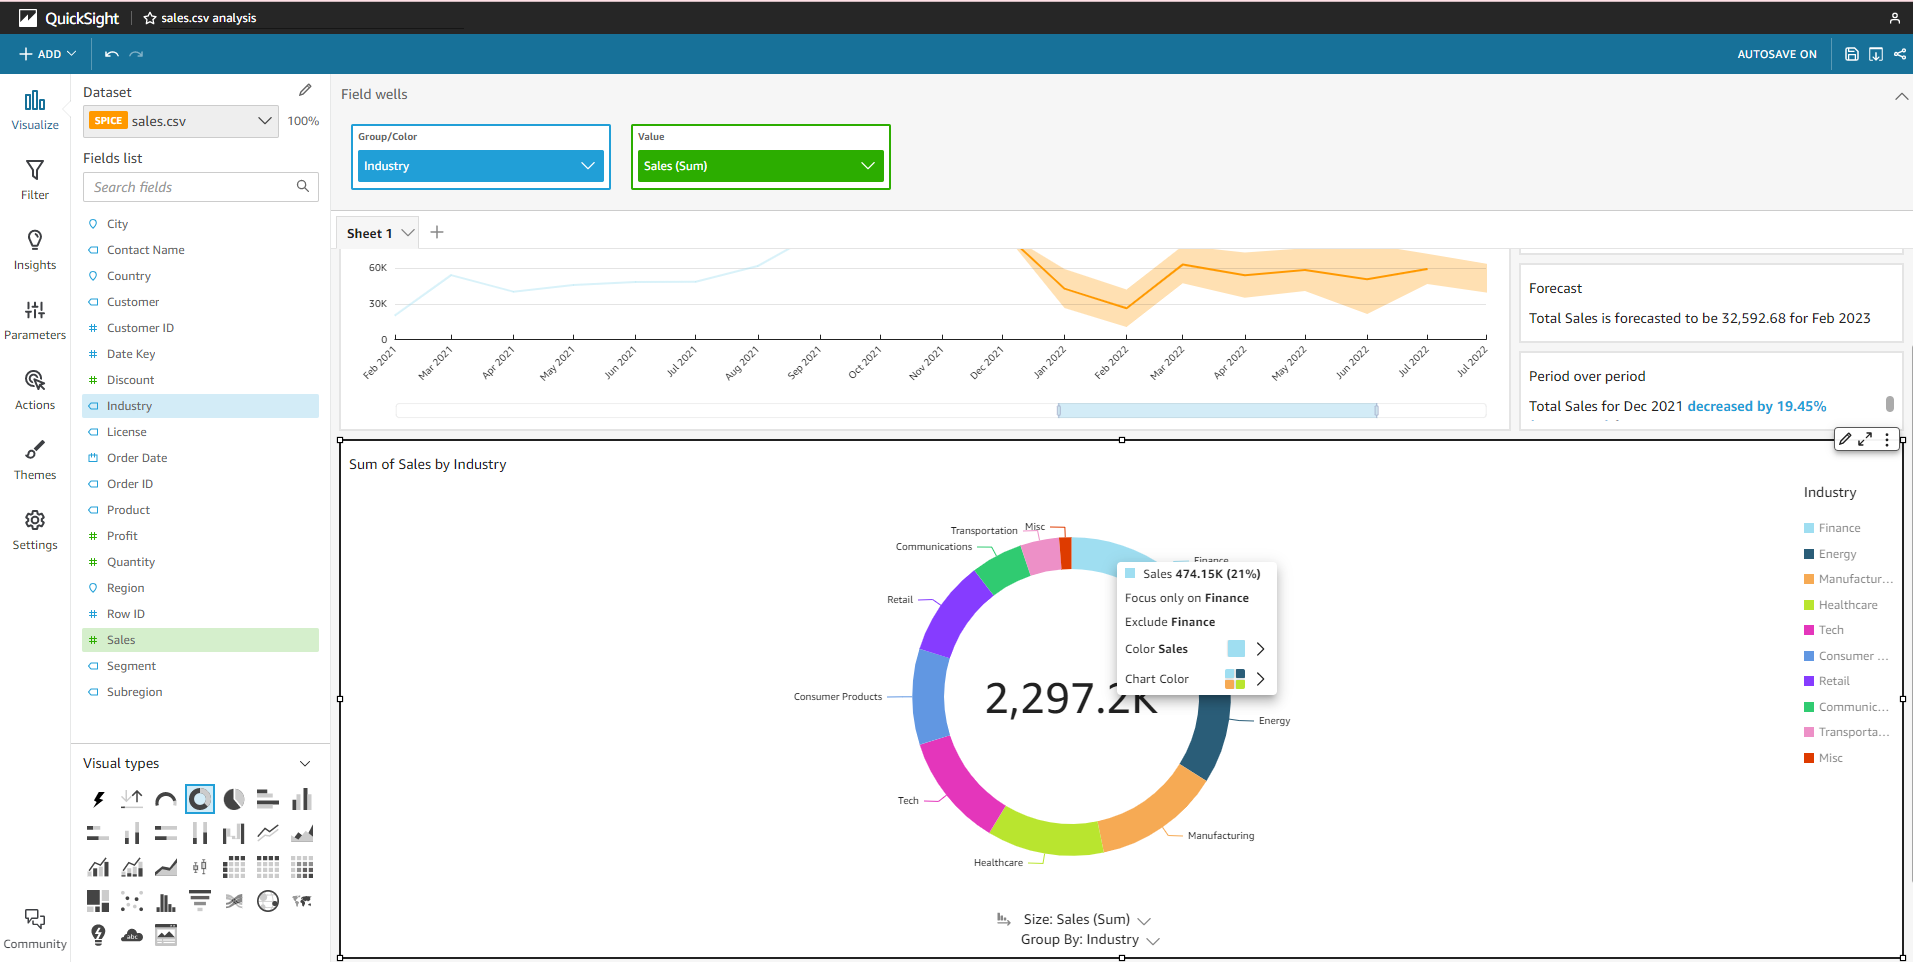
-
Thanks to step 4, you will see the Drill down to Customer section, select this.
-
At this time, the pie chart will show the Customer parameter of the Industry you have selected. In this case, it’s Finance.
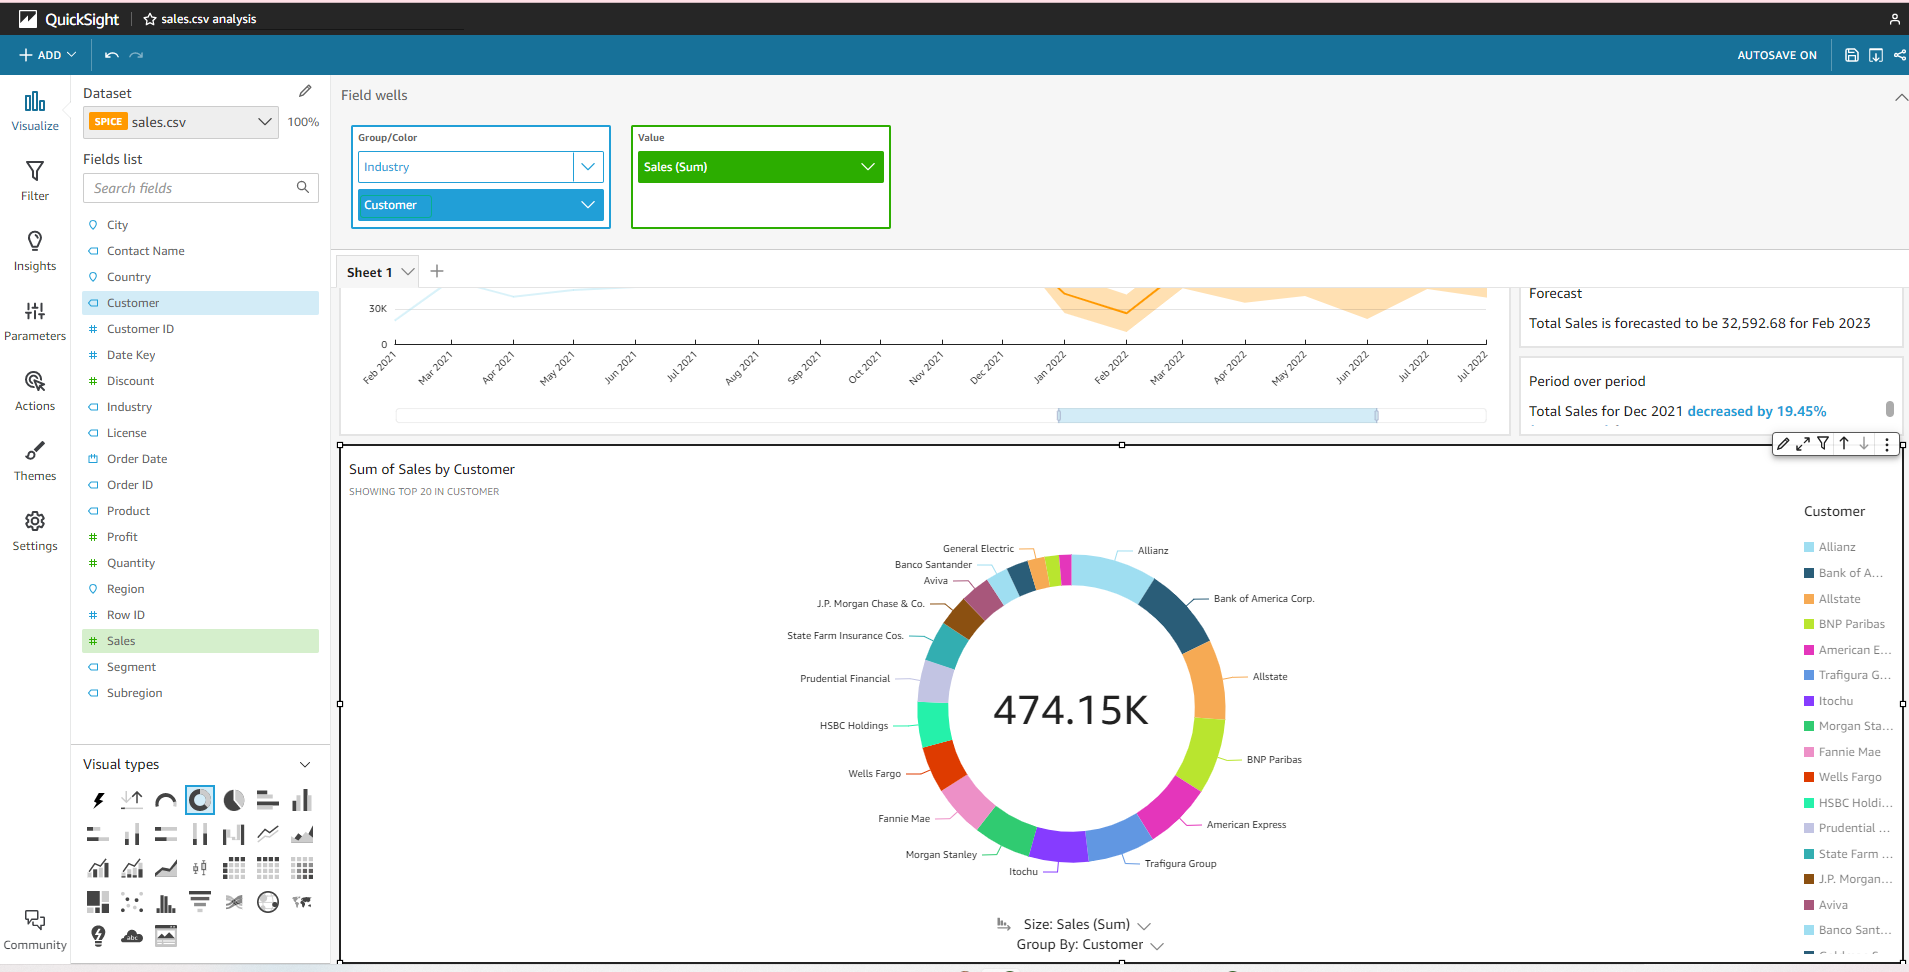
Once done, you can select Undo to return to the main chart.
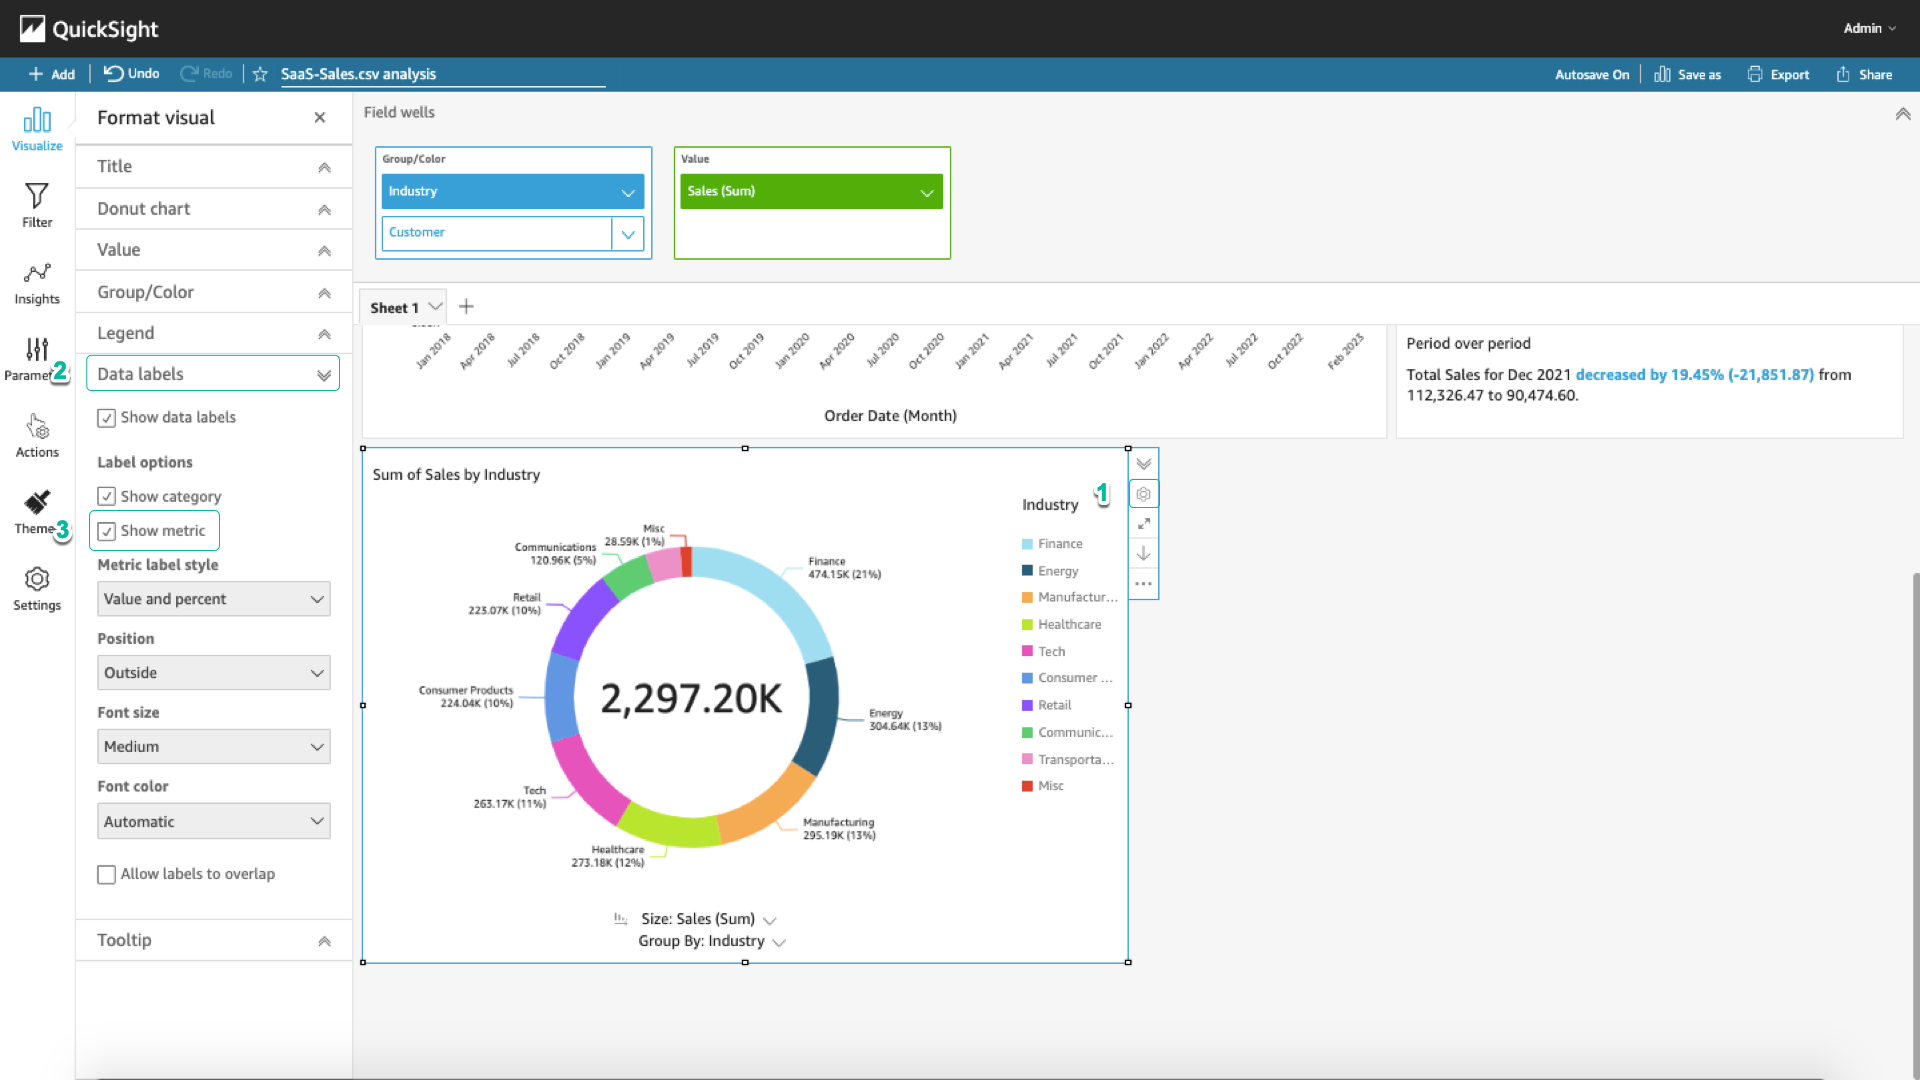
More details
- Select the gear texture in the right corner of the chart.
- Select Data labels > Show metrics.
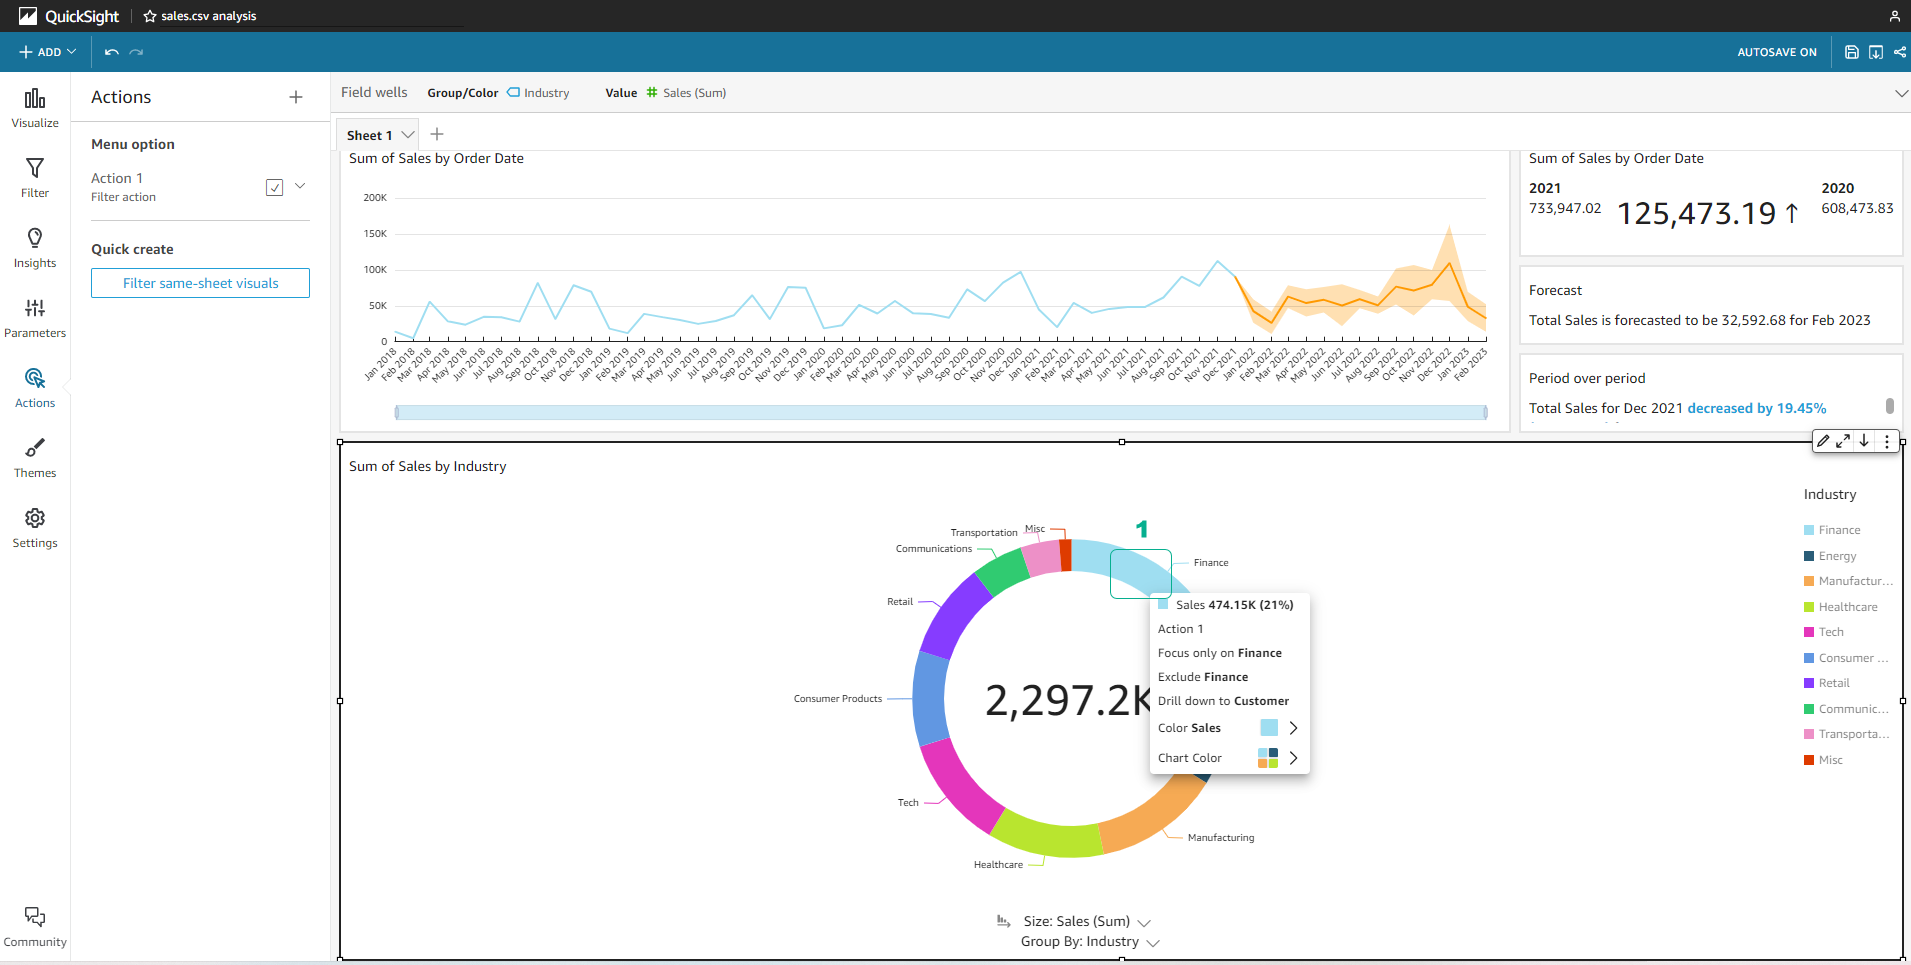
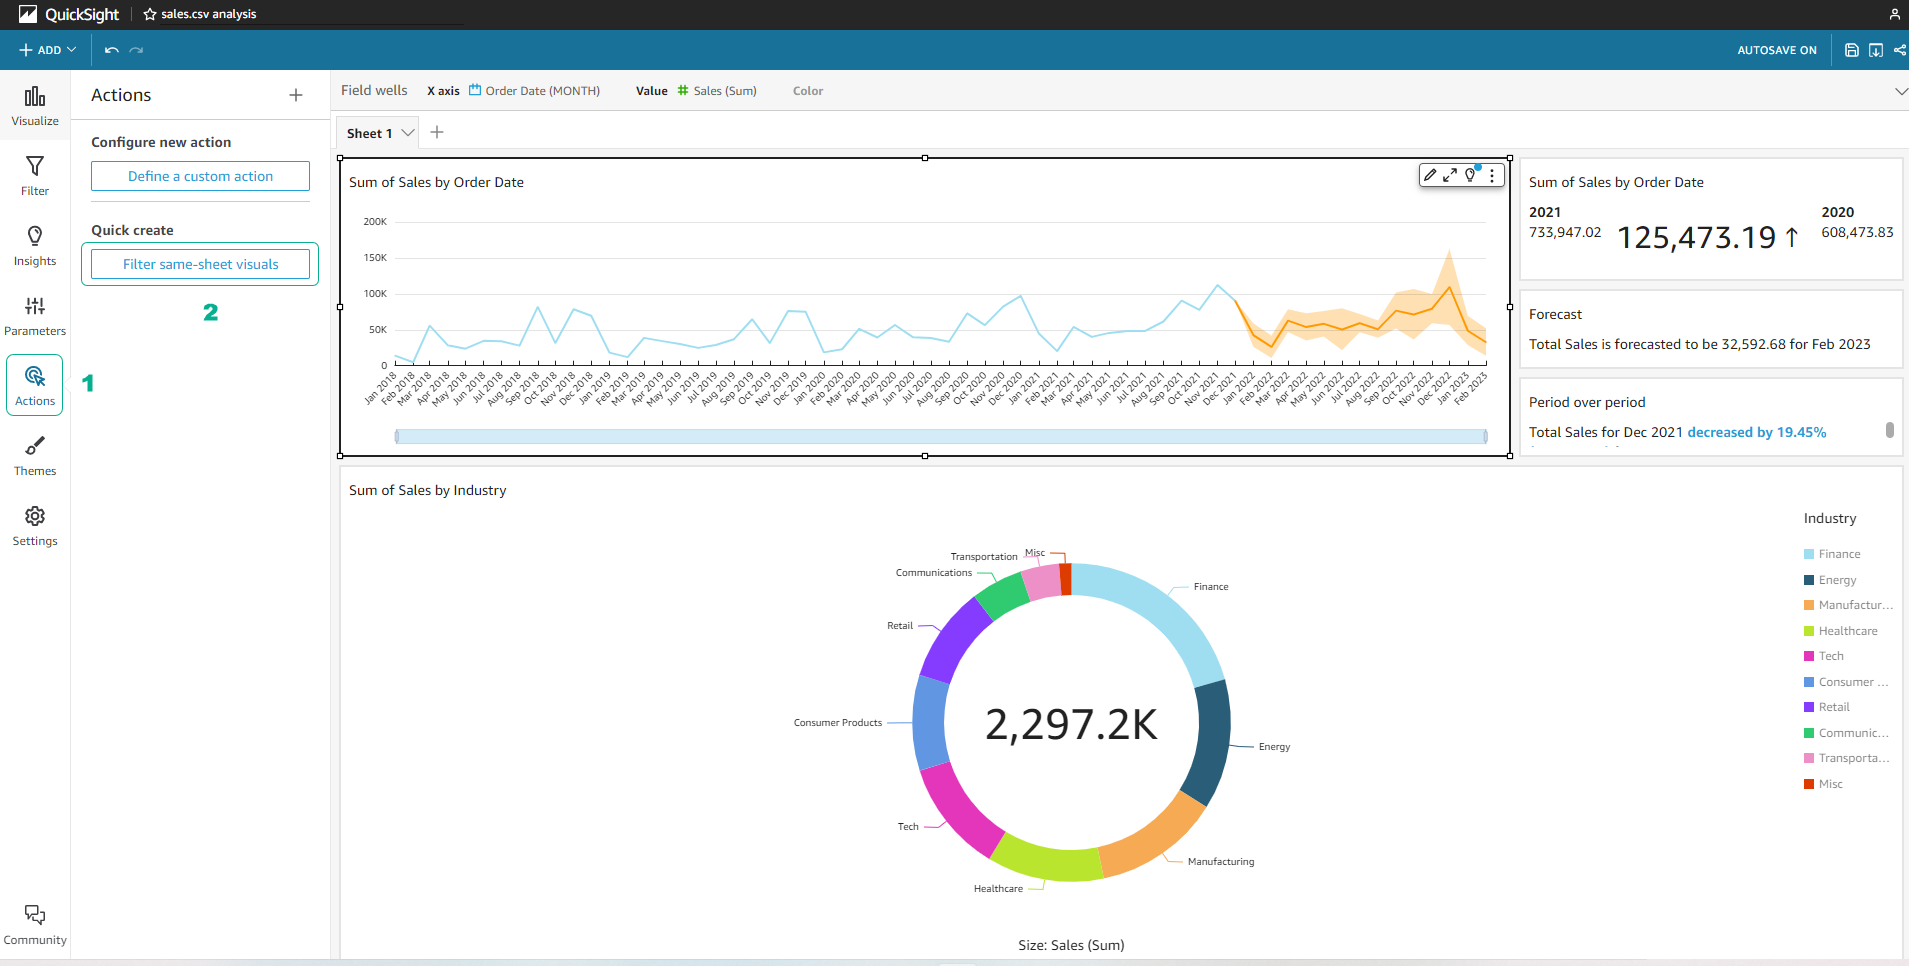
Filter dashboard-wide data by optional industry
-
In the left navigation bar, select Actions > Filter same sheet visuals.
-
When completing step 1, if you select any industry (eg Finance), the parameters in other charts will be filtered and display data of the selected industry.