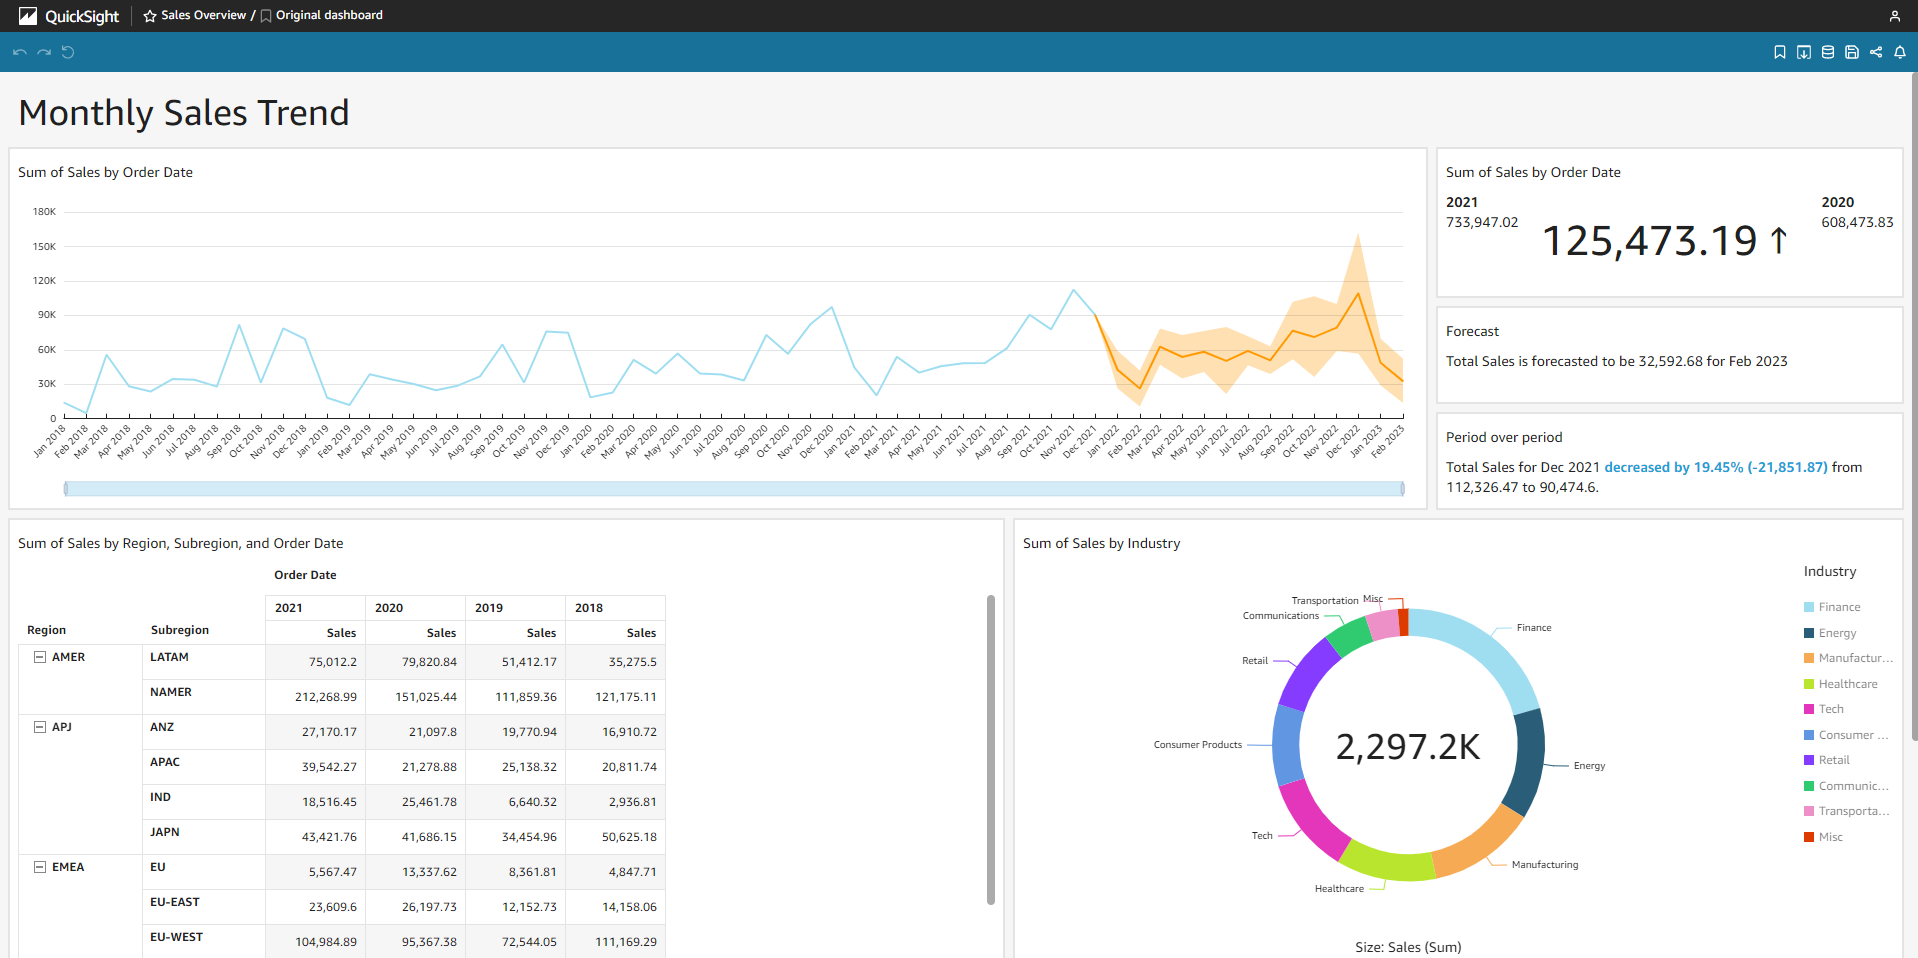
Complete Dashboard
Content
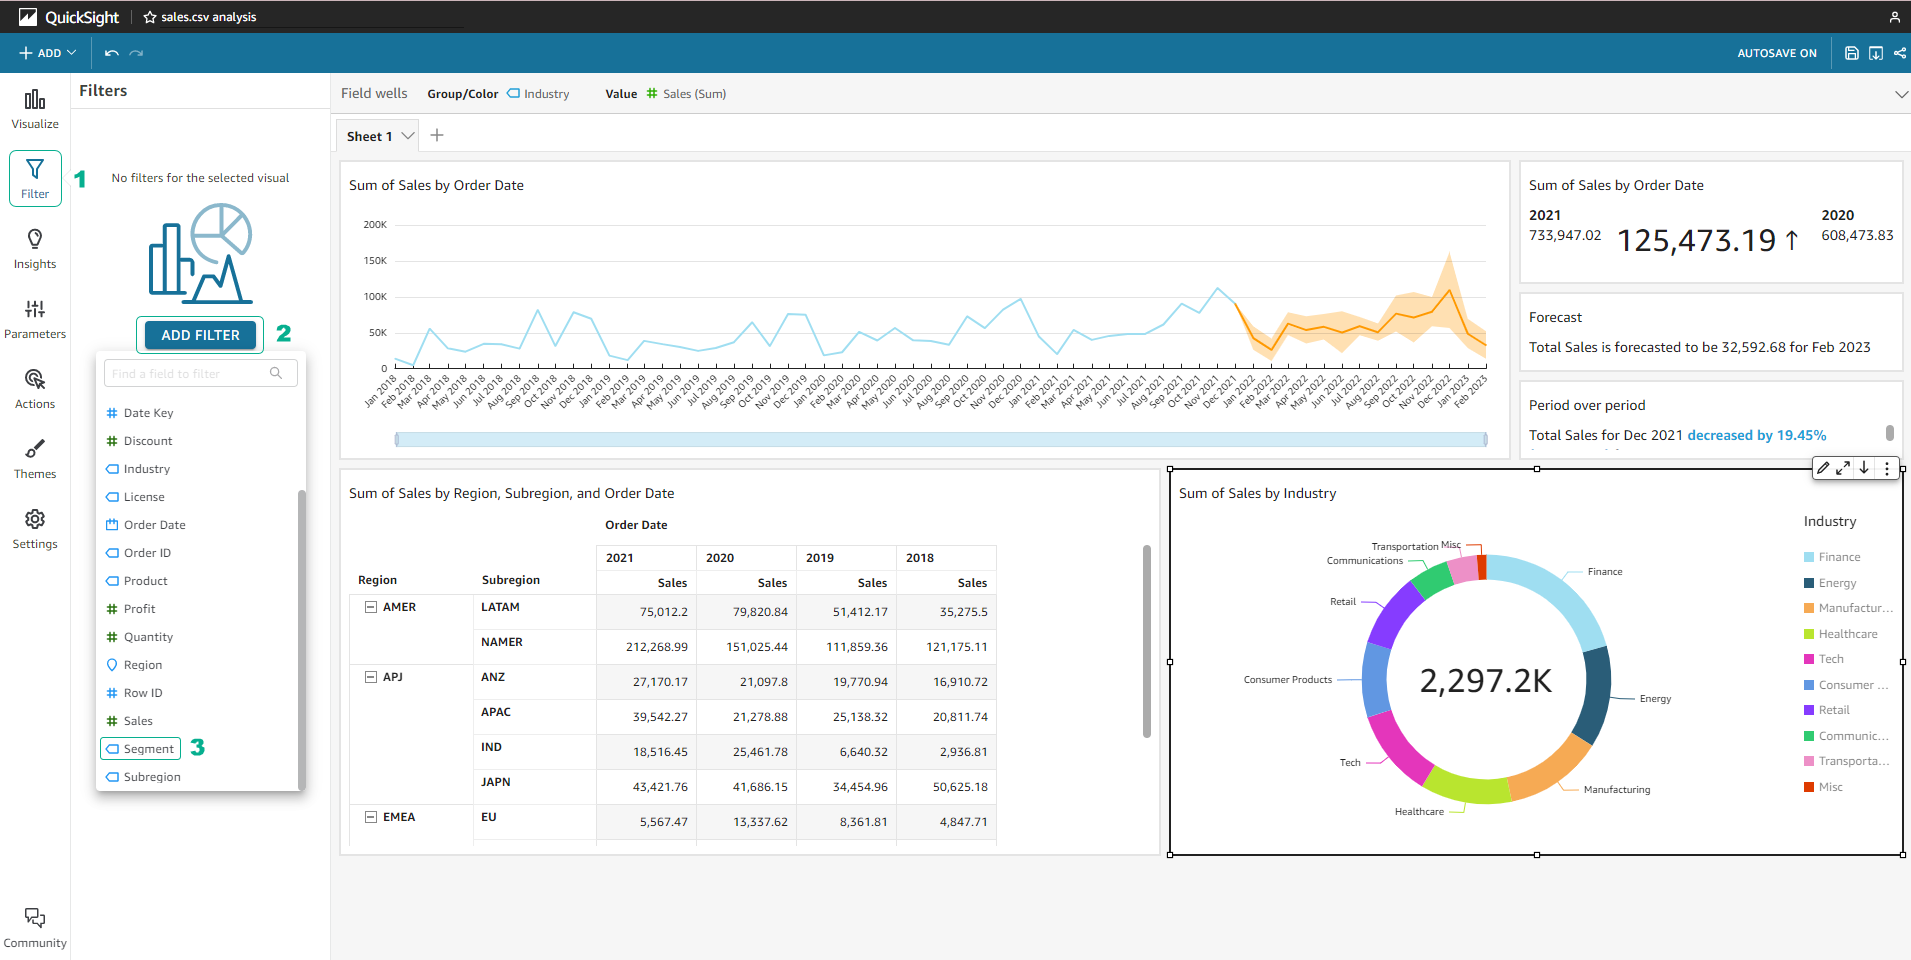
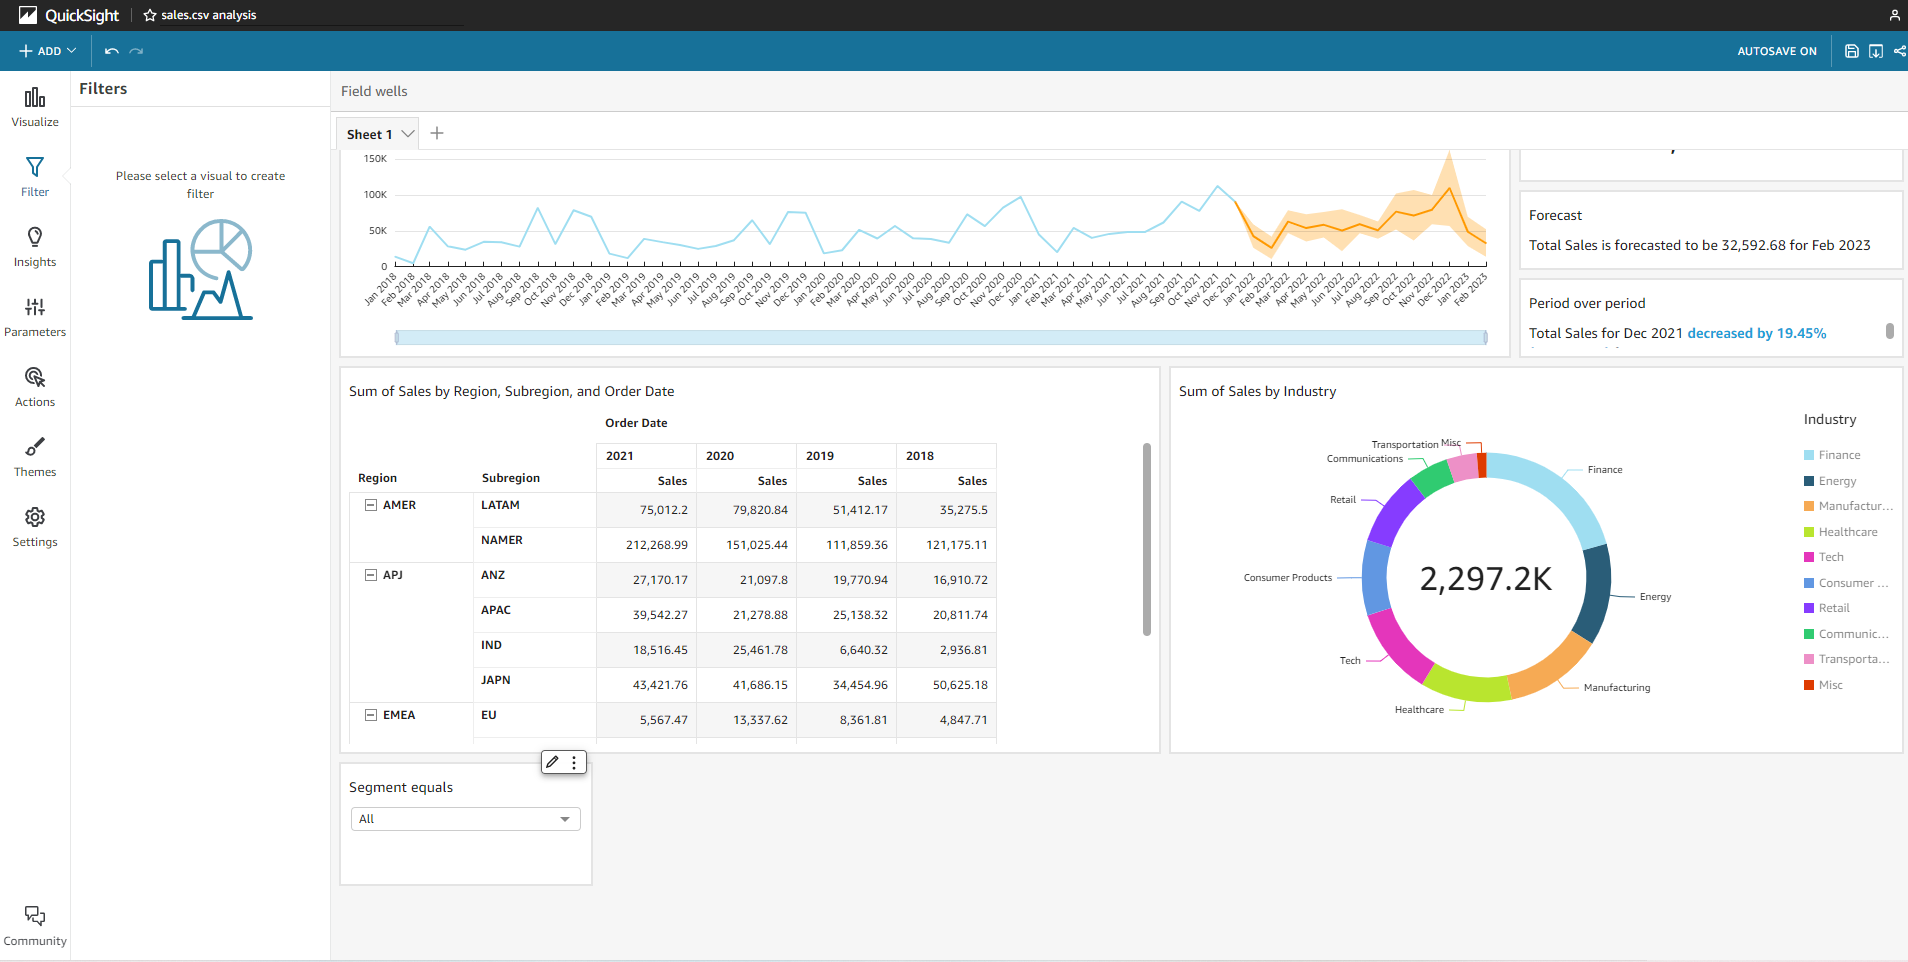
Create filter control
-
In the left navigation bar, select Filter > Create one > Segment.
-
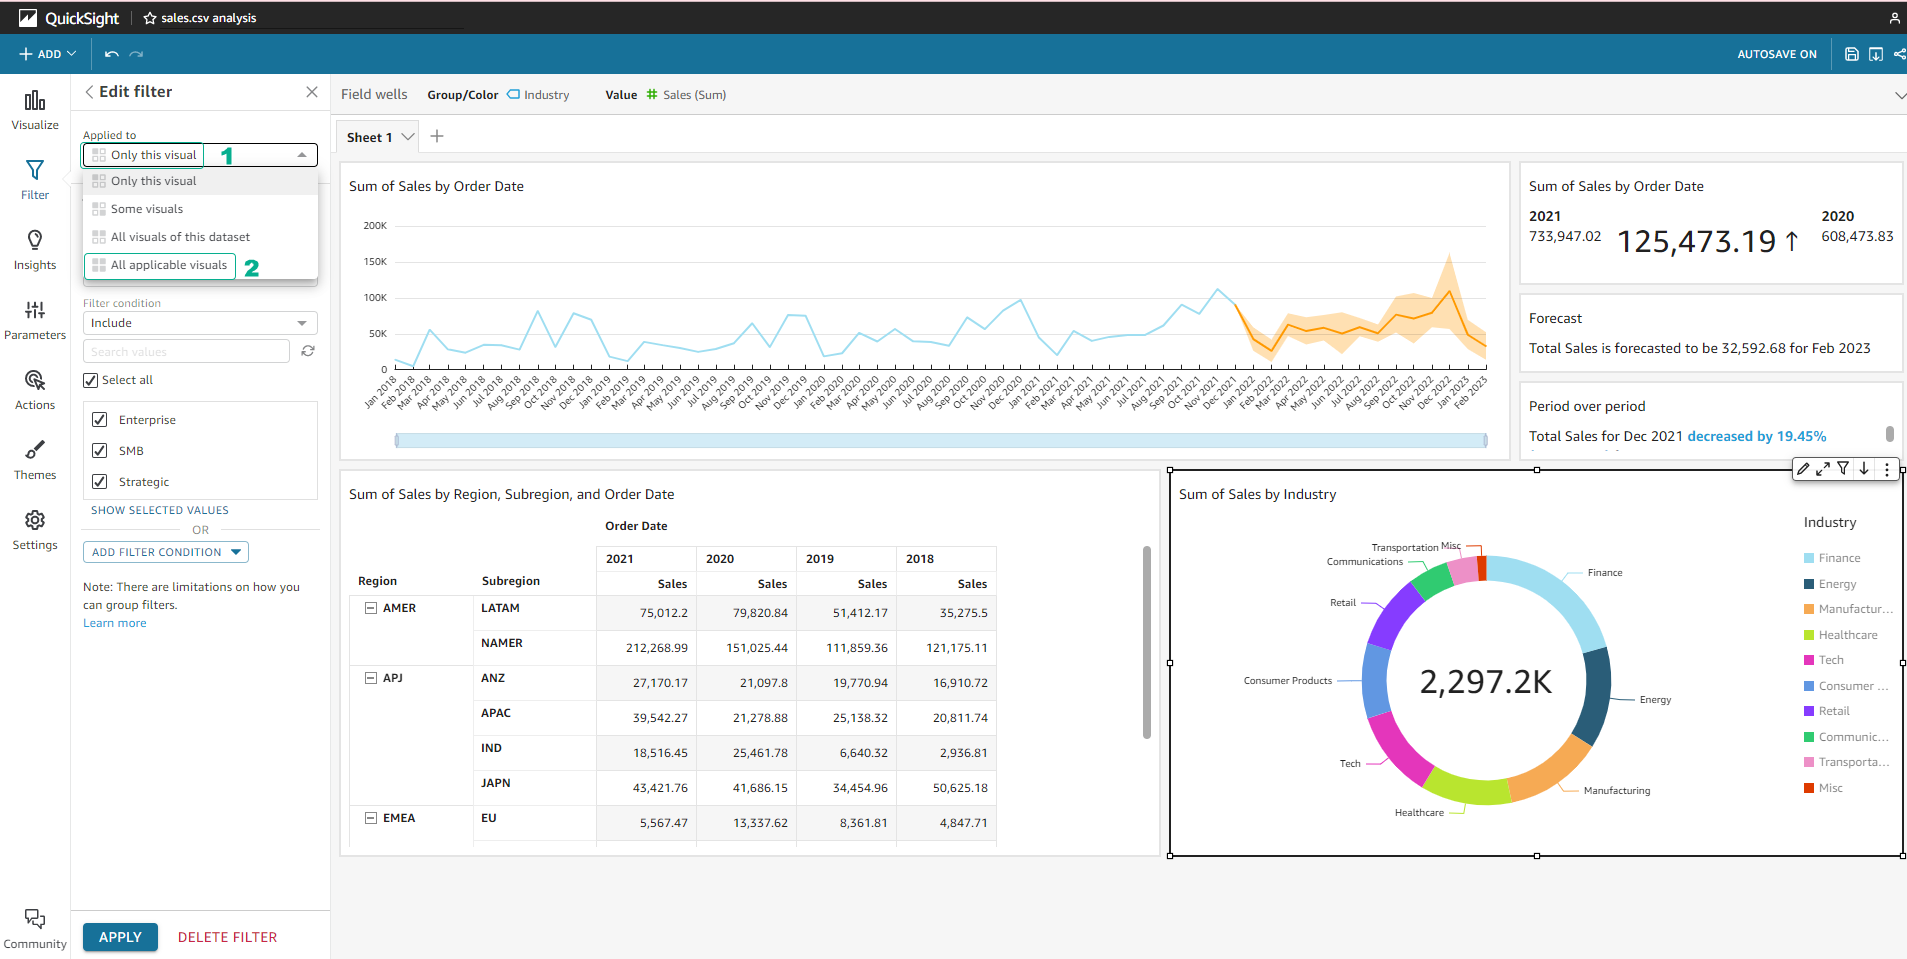
Select the filter you just created. Select the Only this visual section arrow and select All applicable visuals.
-
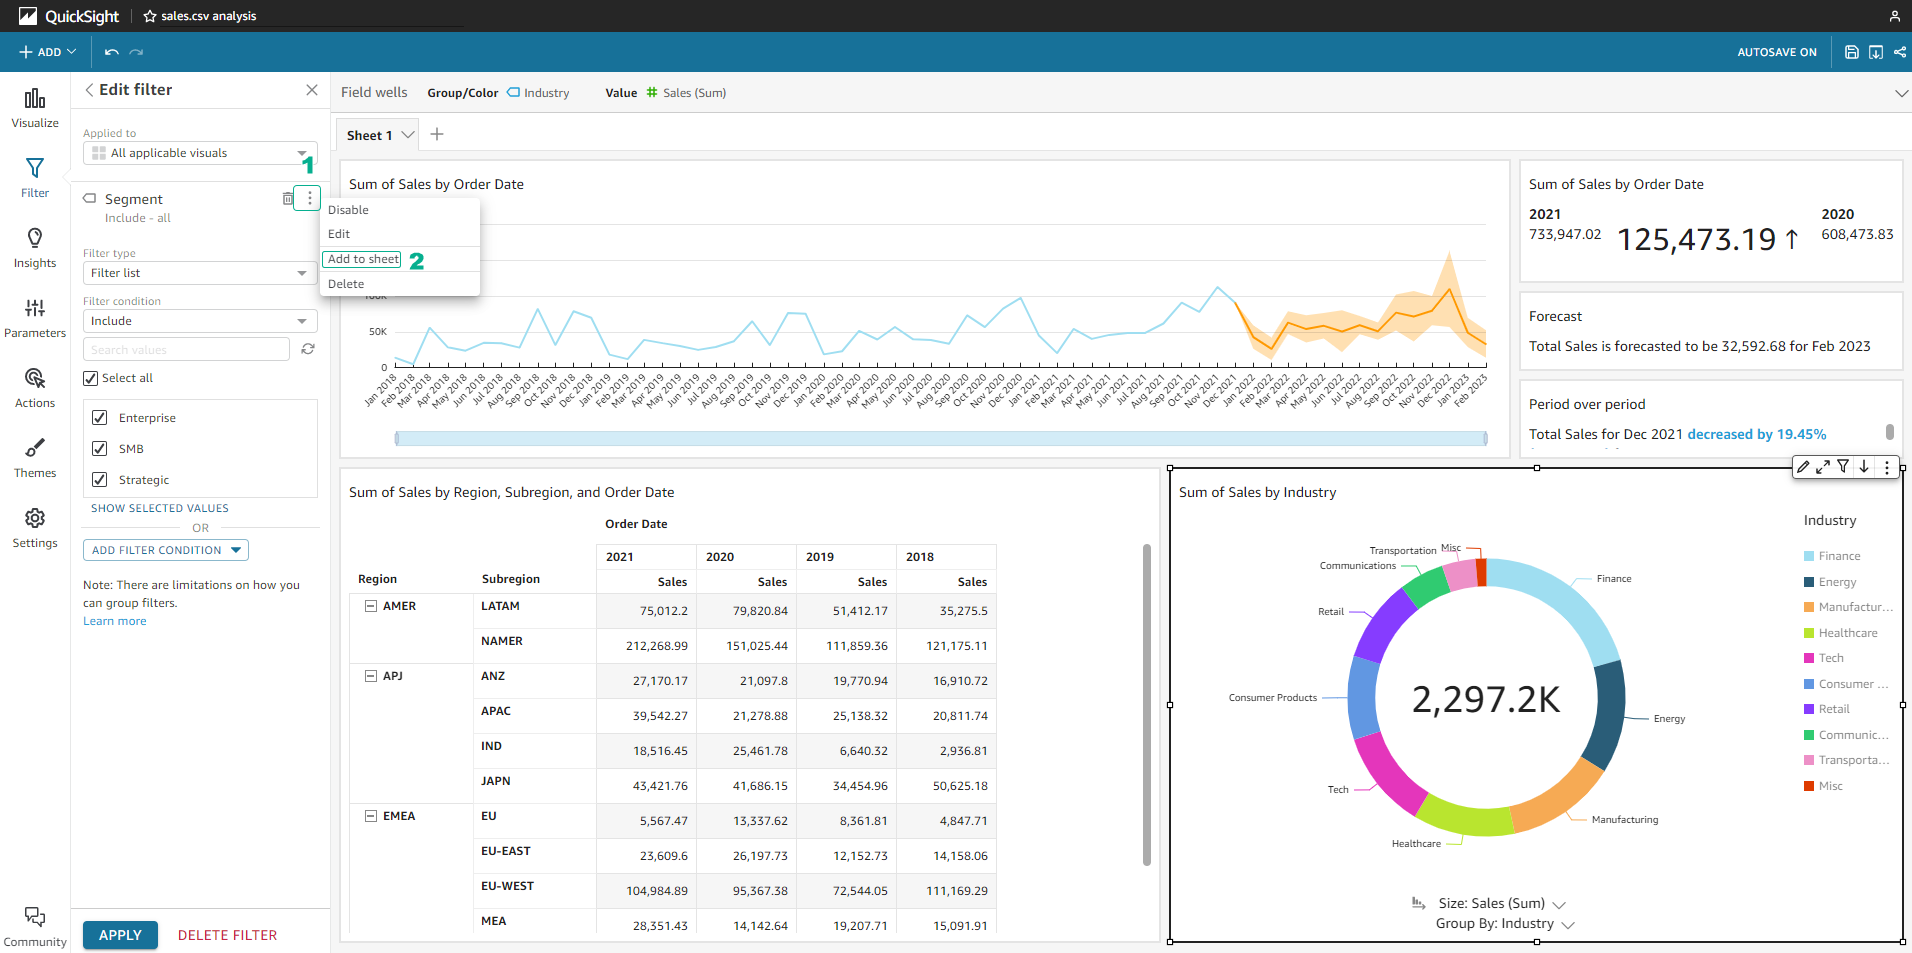
Select the … icon in the right corner of the filter and select Add to sheet.
-
Collapse the filter you just created. This filter will allow you to filter data based on market segments.
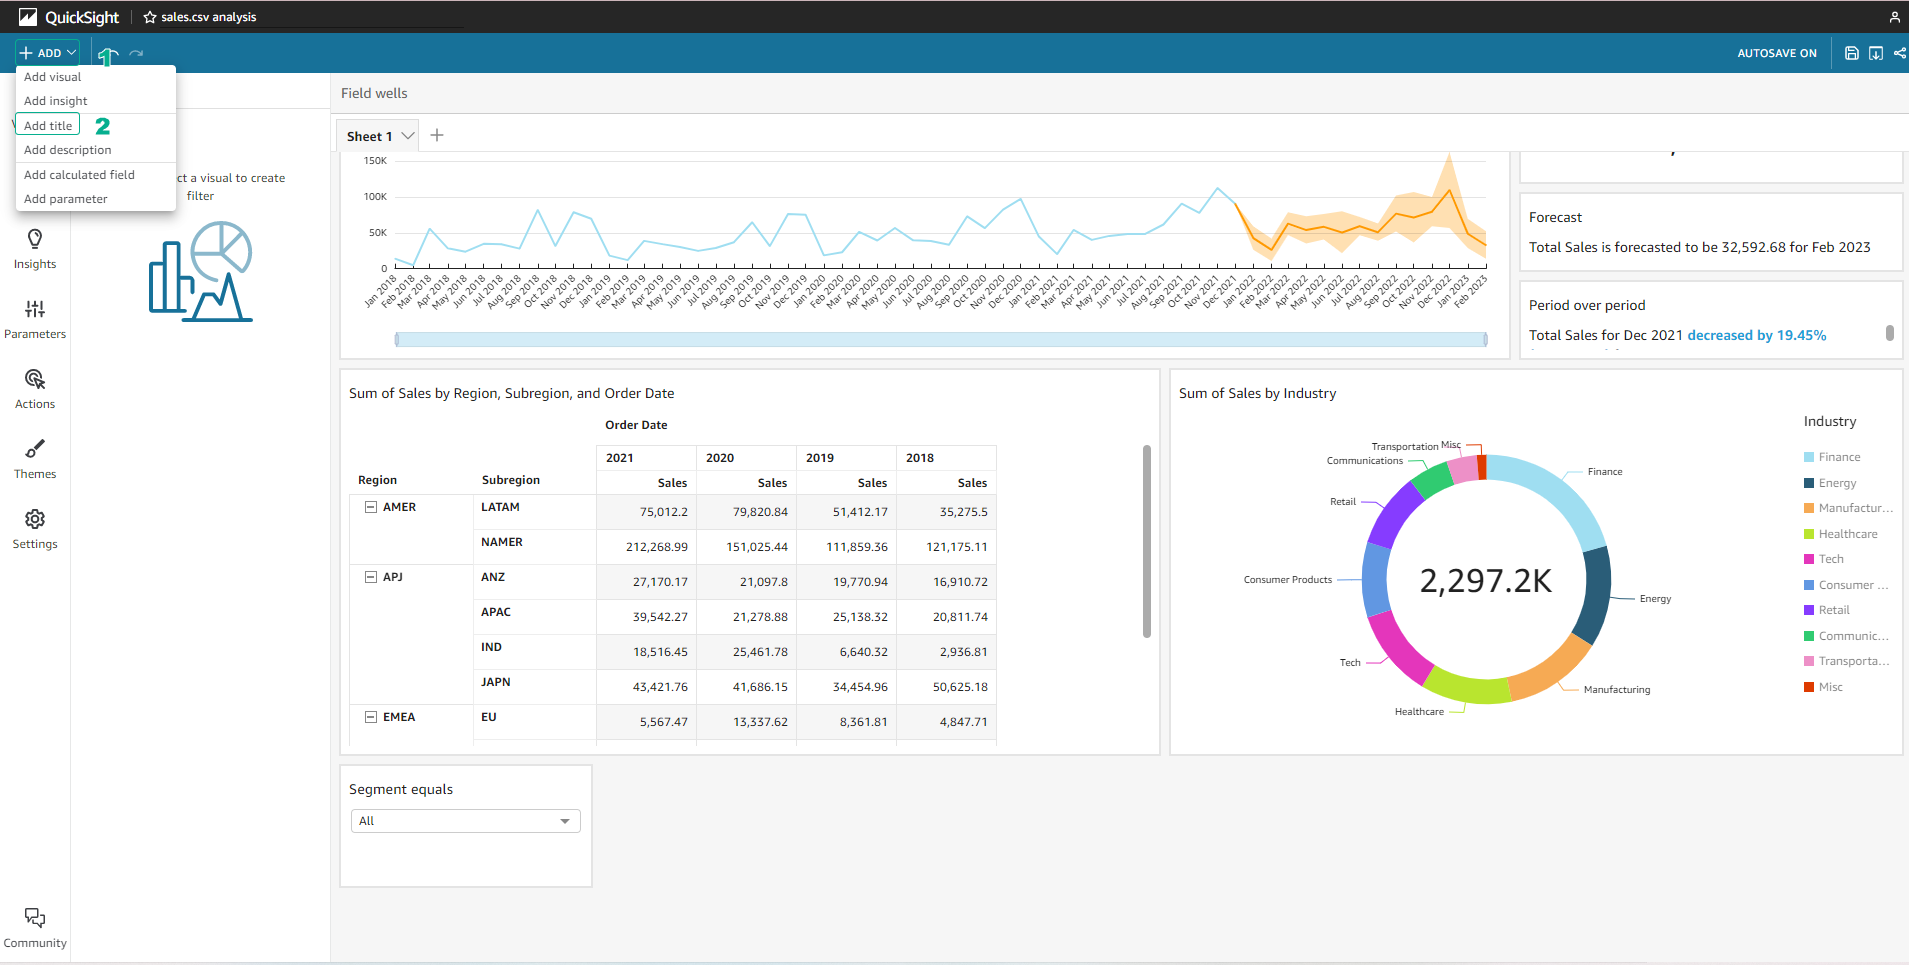
Add dashboard title
-
In the left corner, select Add > Add title.
-
Add an optional title (eg
Sales Overview Dashboard).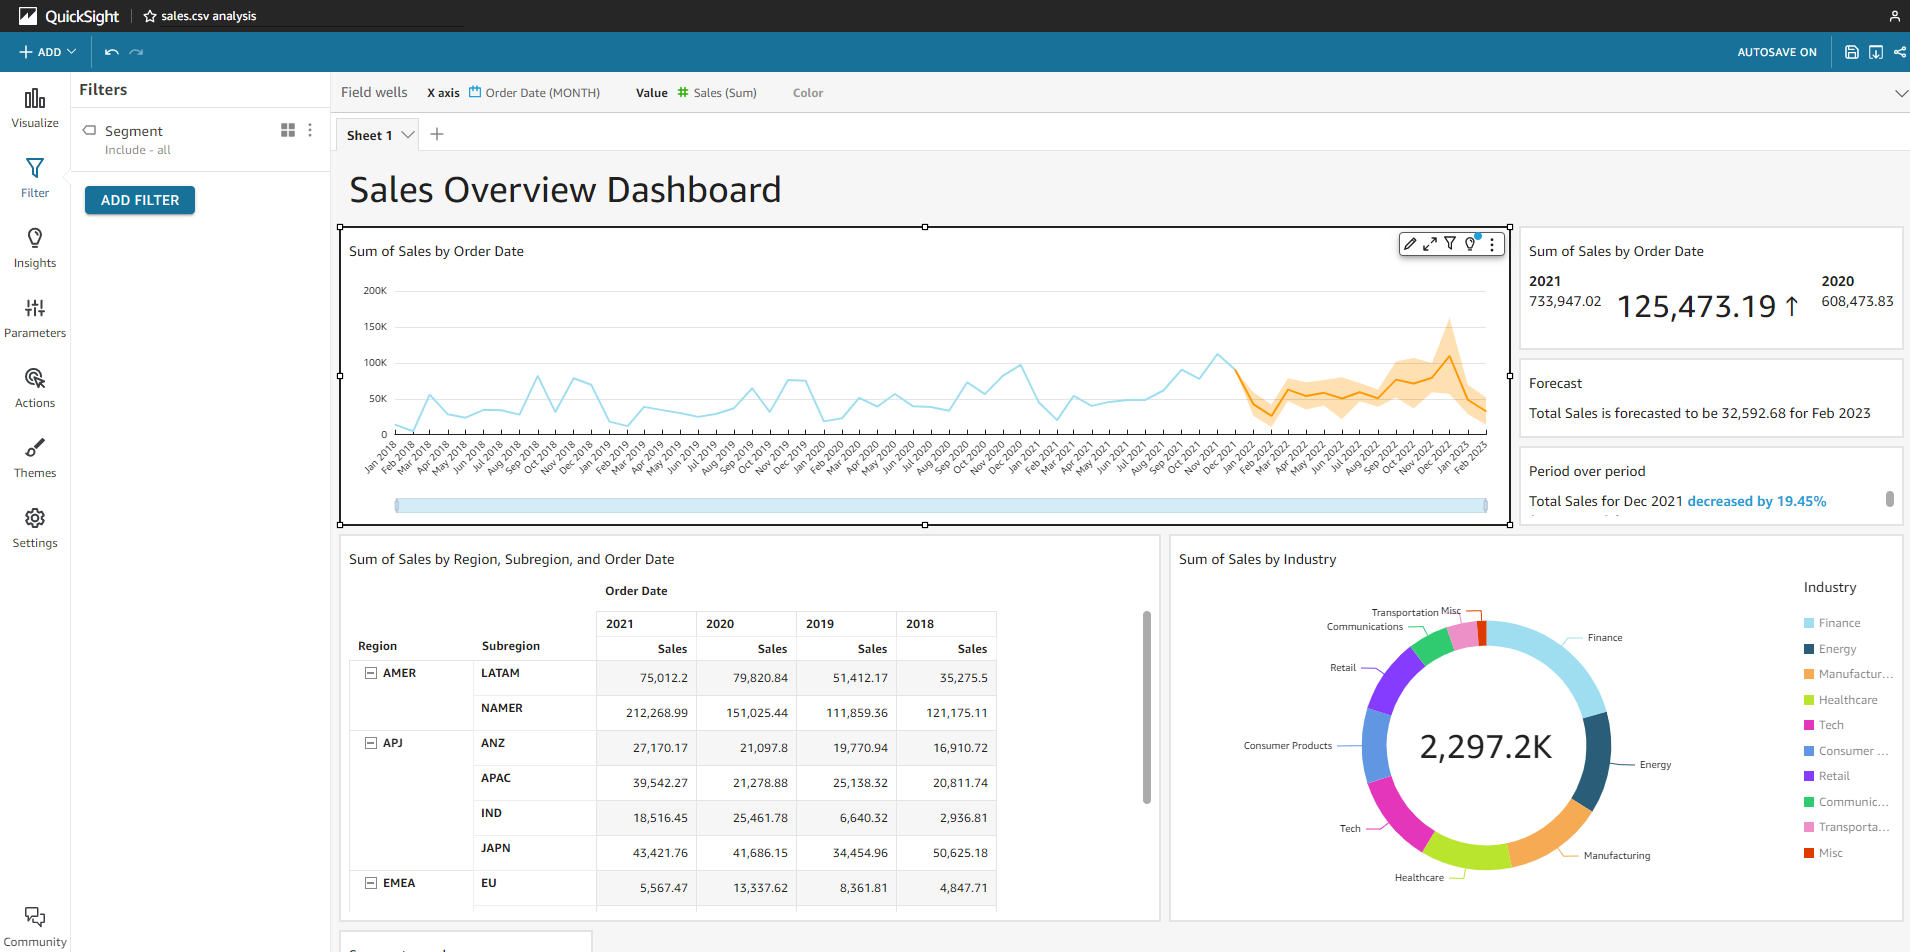
Change chart title
- Select the gear icon in the right corner of the chart you want to change the title.
- Select the item Title. Enter the desired name in the Edit title field (eg
Monthly Sales Trend).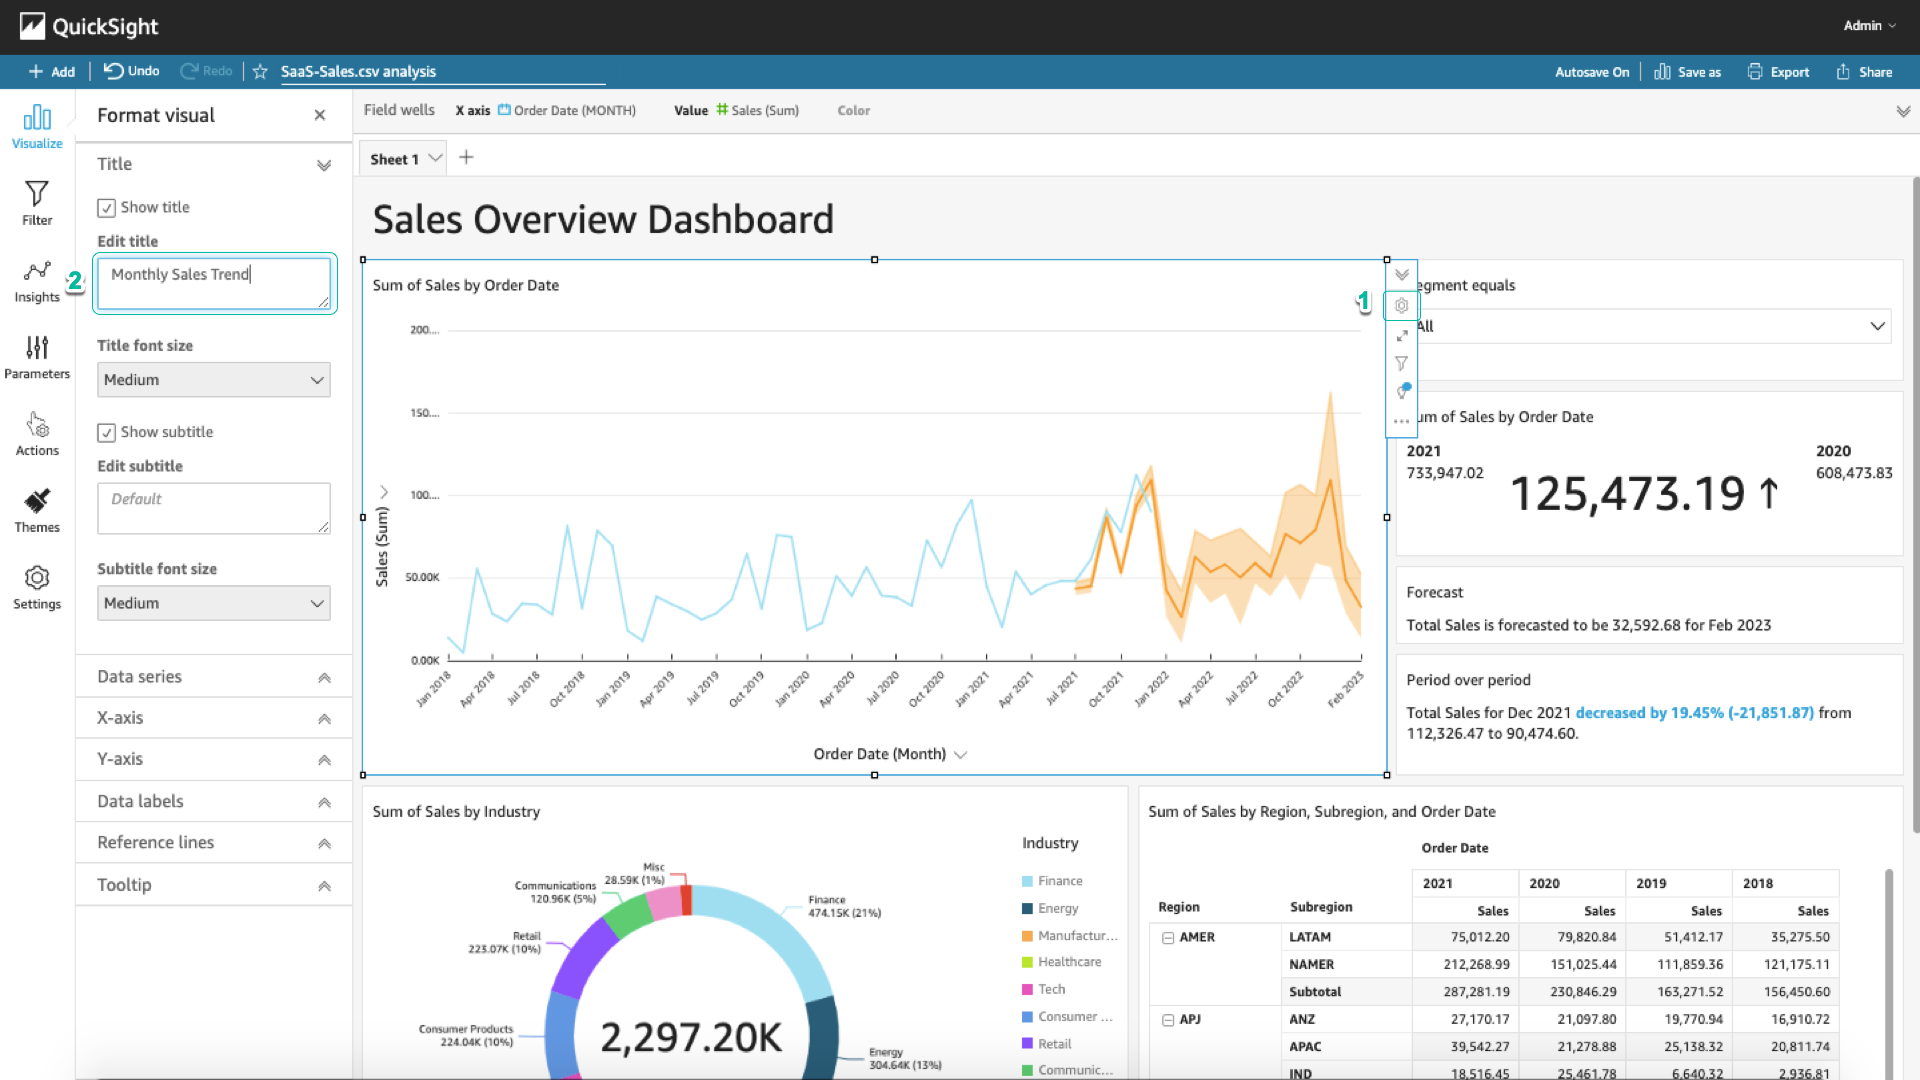
- Do the same with the other charts. For example:
- KPI:
YOY Sales - Pie chart: `Sales by Industry
- Pivot Table:
Regional Details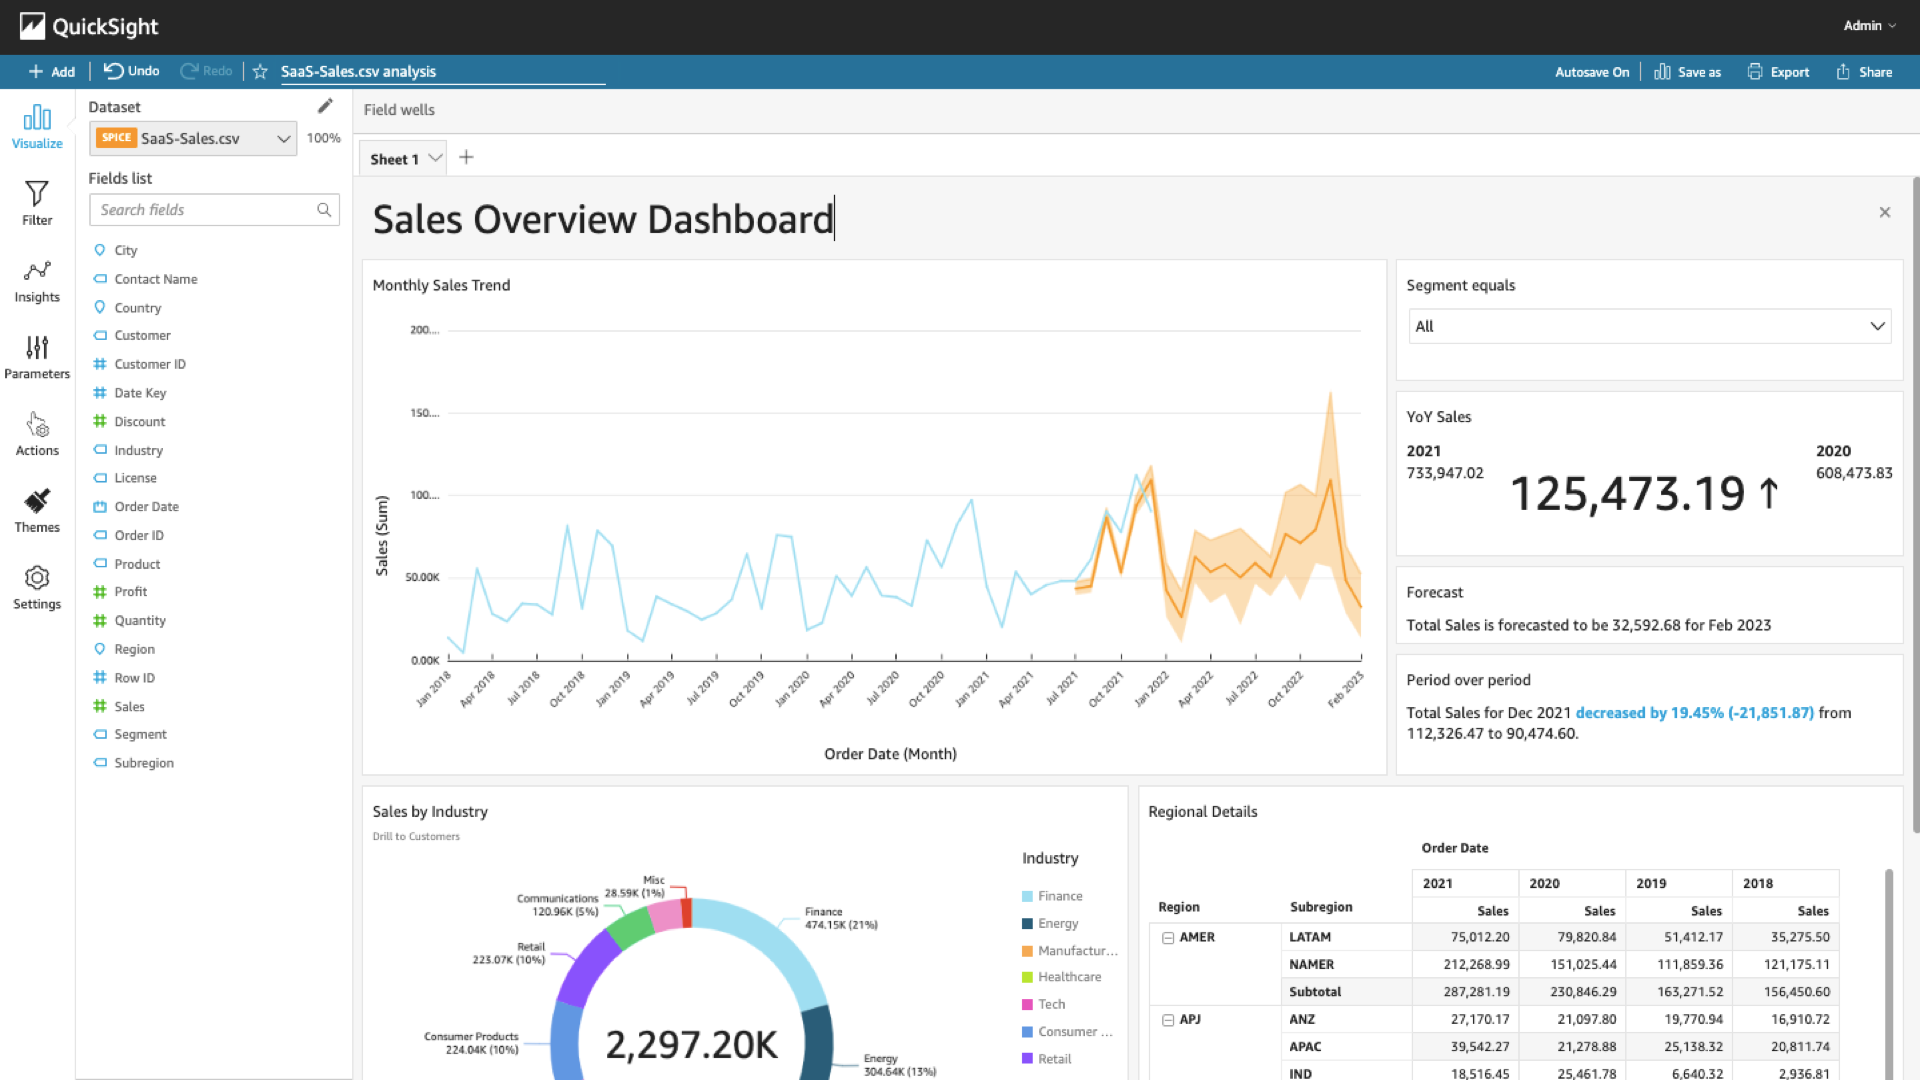
You can change the name by clicking on the title of the chart > enter the desired name > Enter to save.
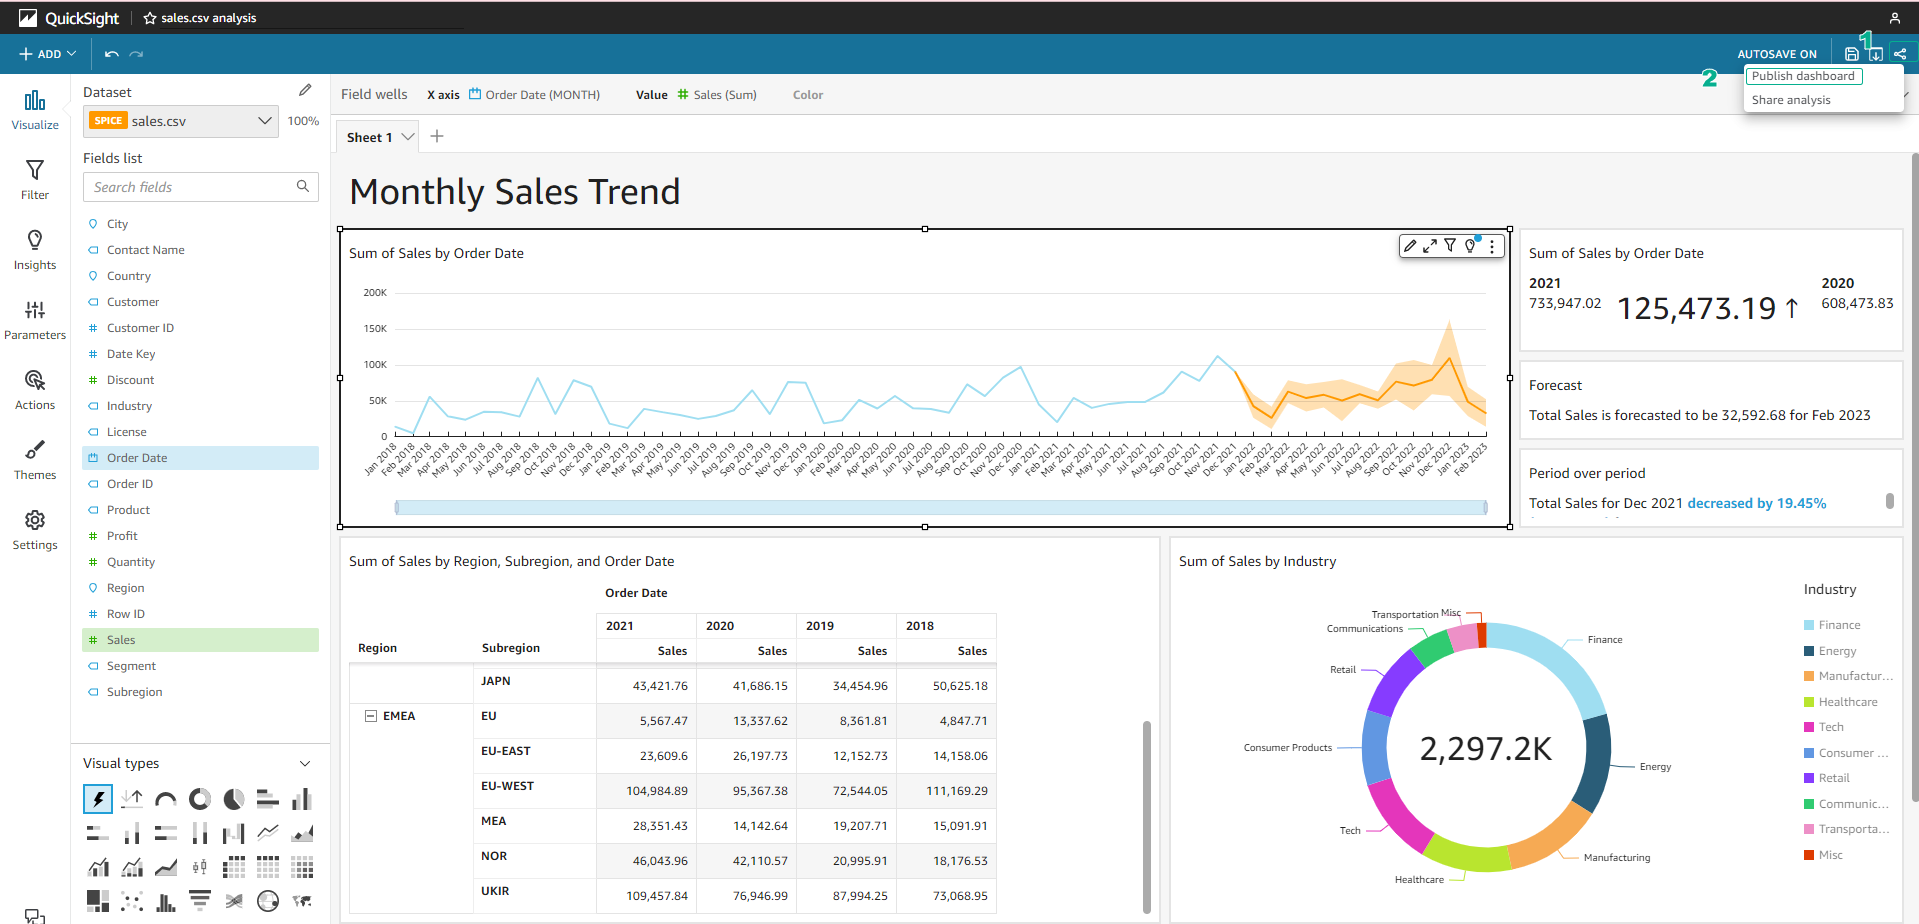
Publish dashboard
-
In the right corner, select Share > Publish dashboard.
-
Enter the dashboard name (eg
Sales Overview). Select Publish Dashboard.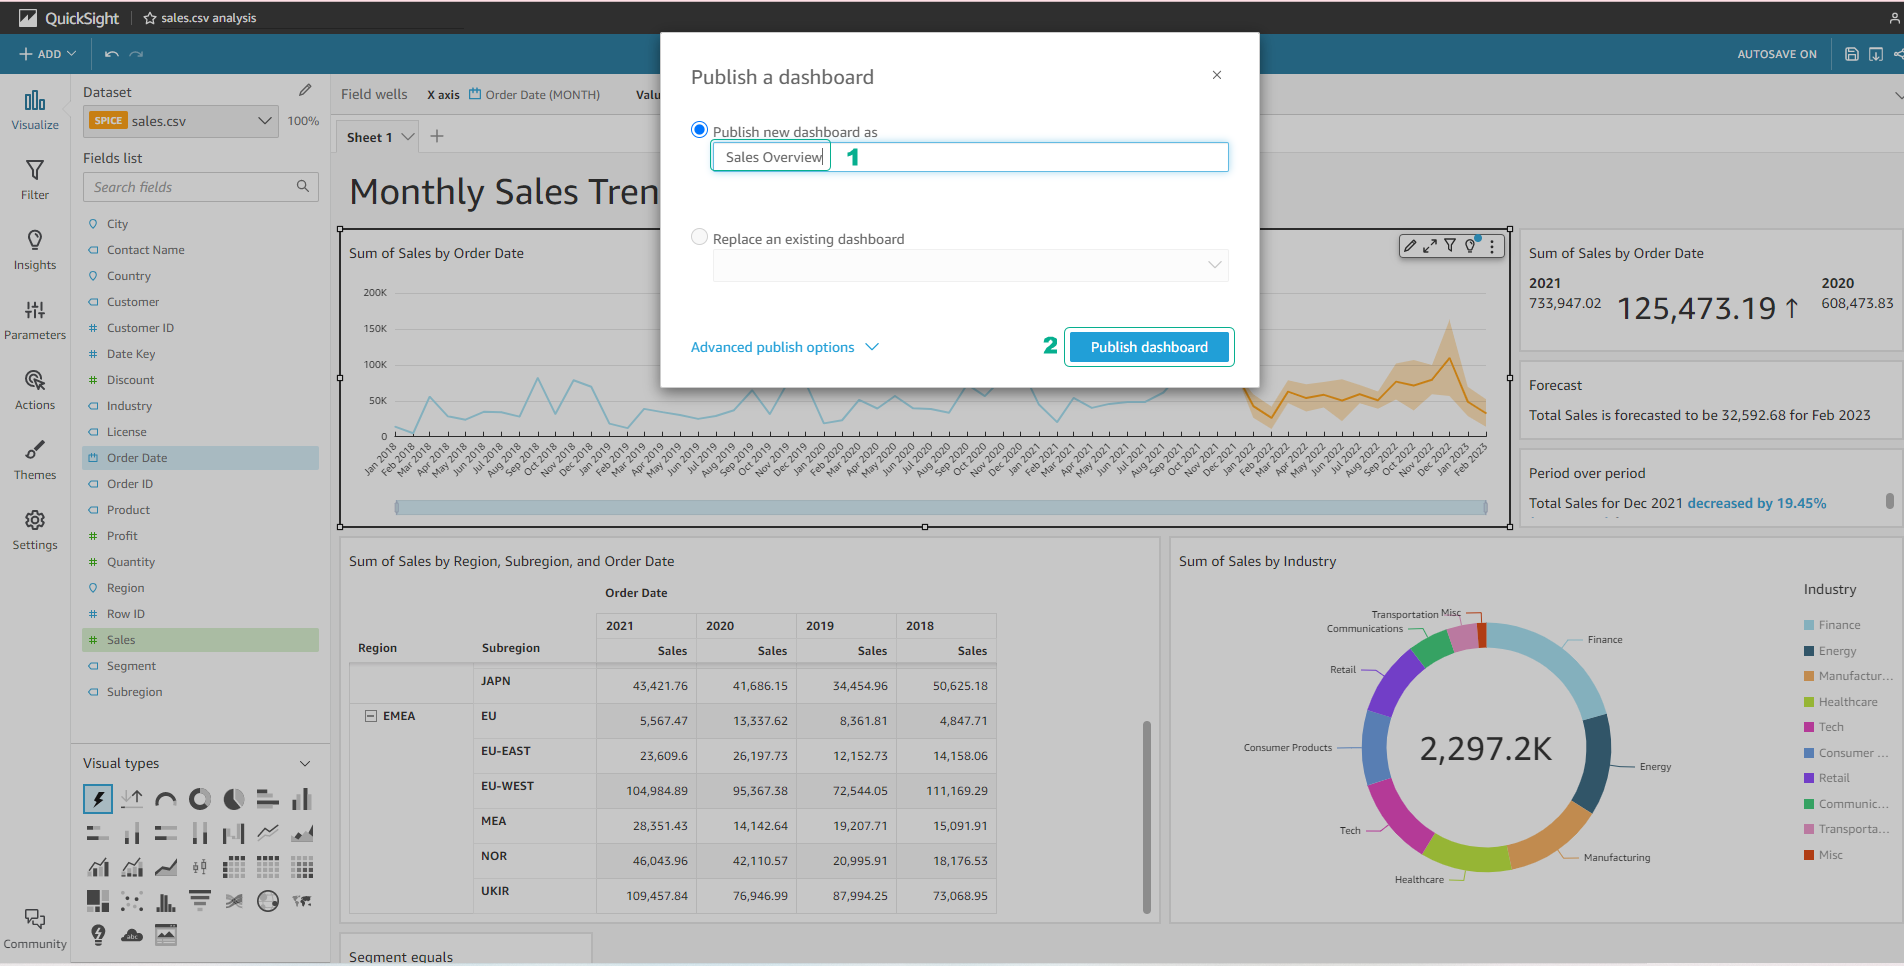
-
In this part, we will skip the Share dashboard screen by selecting the x in the right corner. Your Dashboard has been created successfully.