Additional charts
Content
Sankey chart
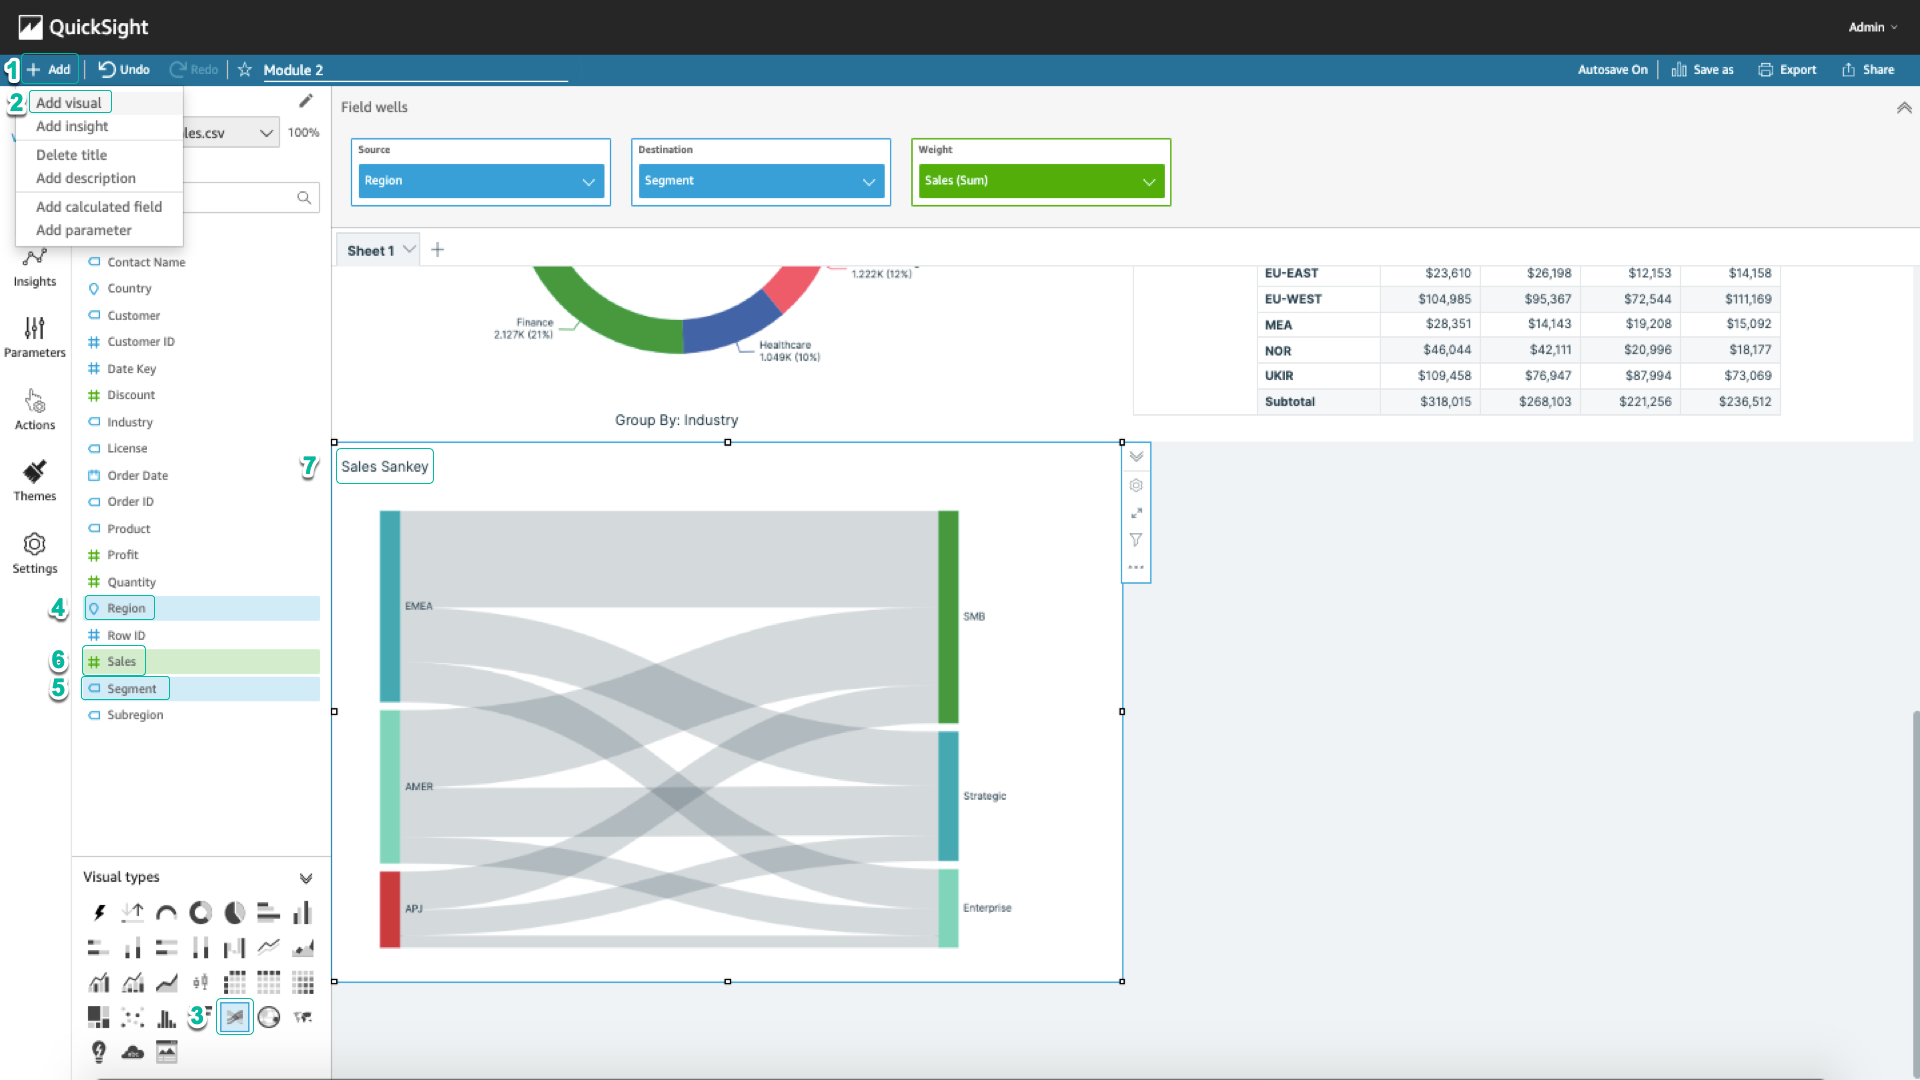
- In the right corner, select Add > Add visual.
- At the bottom right corner of Visual types, select Sankey Diagram.
- In the Fiels list, select Region, and Sales.
- Rename the chart to
Sales Sankey.
Sales Map
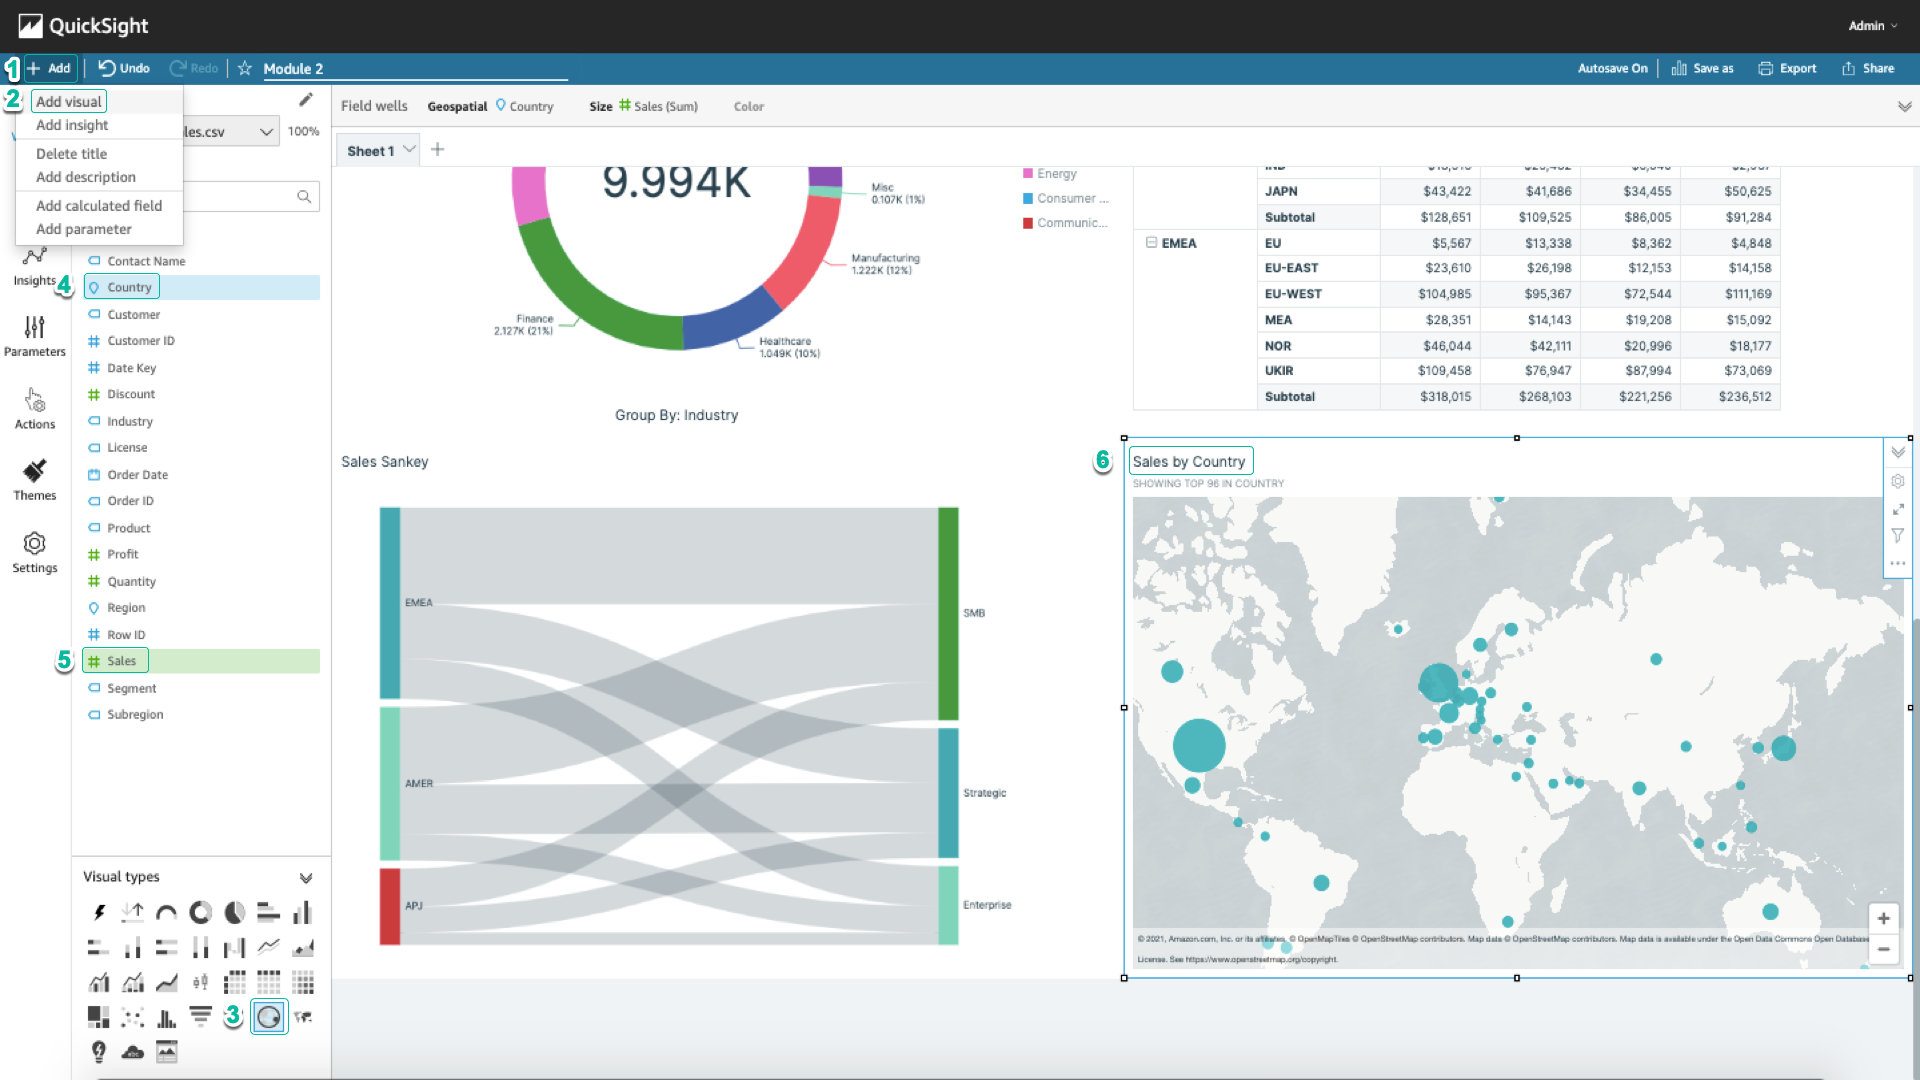
- In the right corner, select Add > Add visual.
- At the bottom right corner of Visual types, select Points on map.
- In the Fields list, select Country, and Sales.
- Rename the chart to Sales by Country.
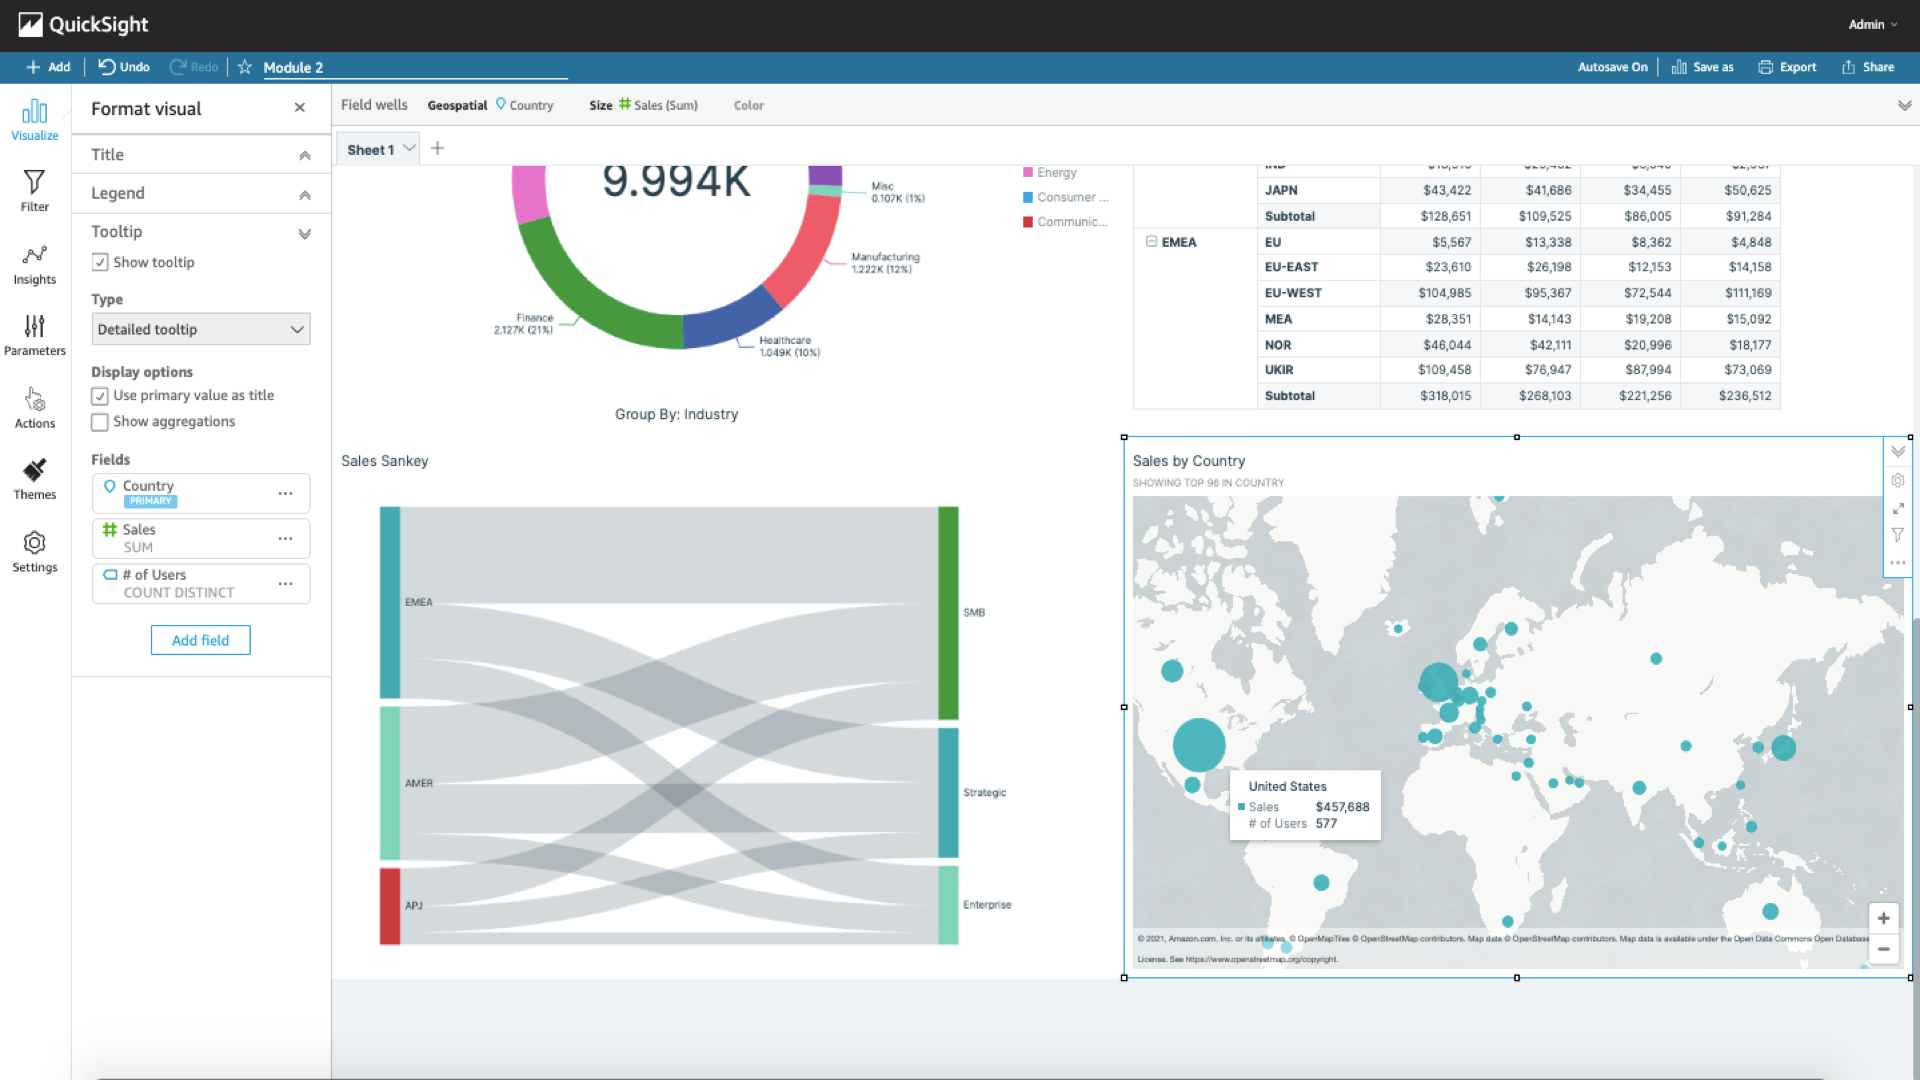
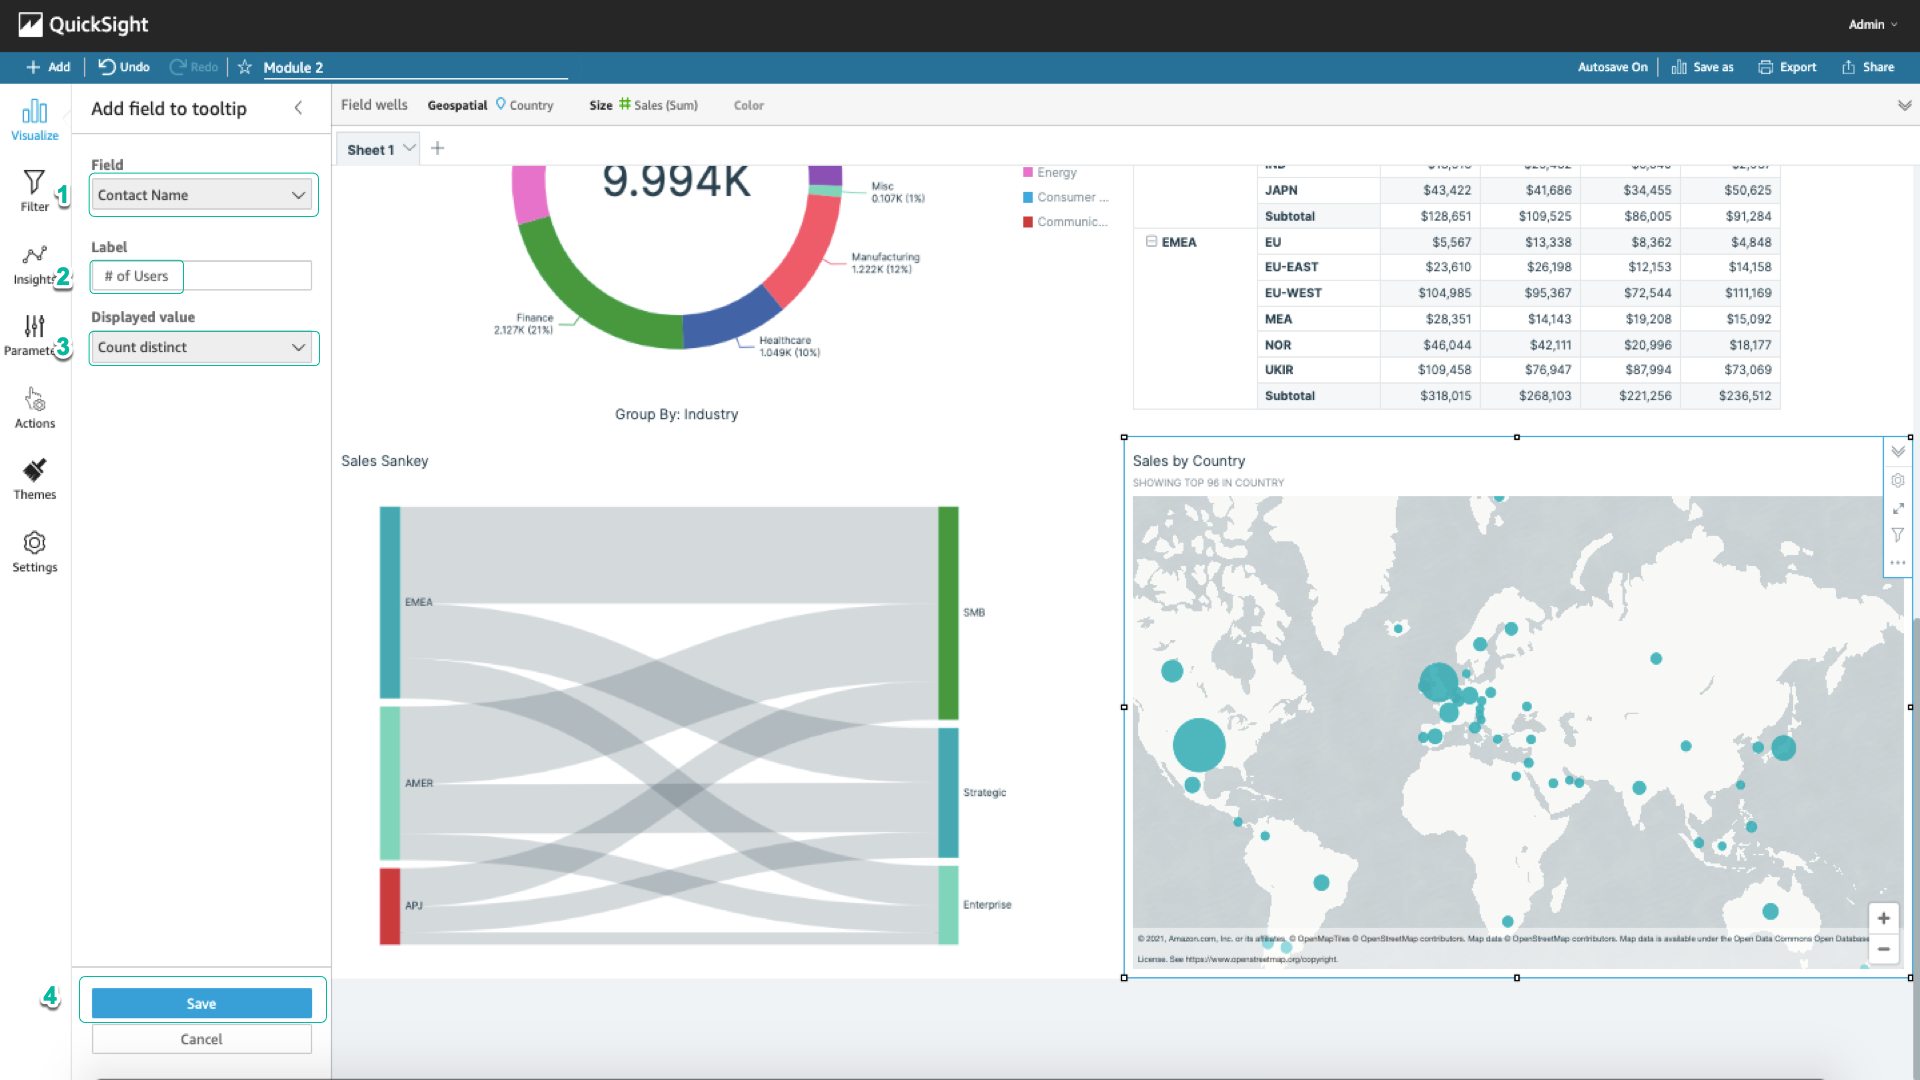
- Select the gear icon in the right corner of the chart, select Tooltip, change the type to Detailed tooltip, and select Add field.
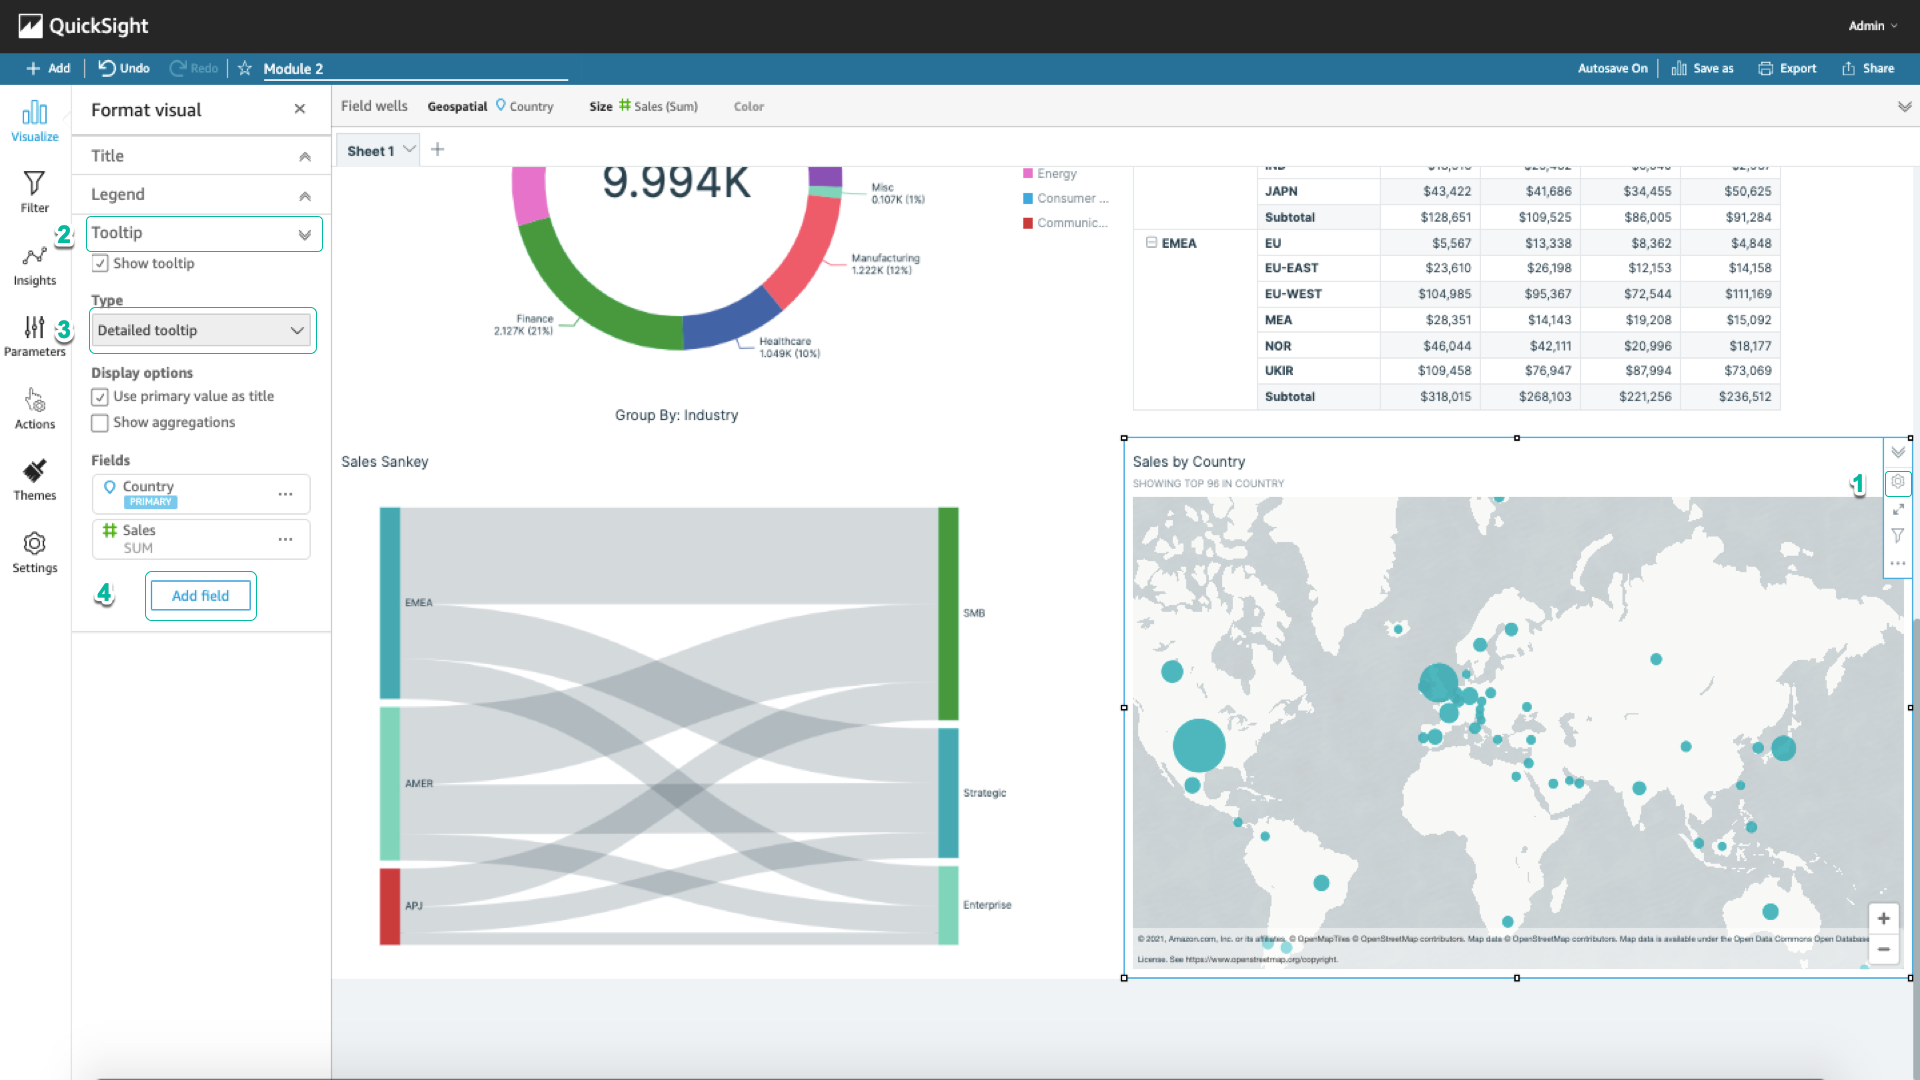
-
In the Field section, select Contact Name; Label entry - enter
# of Users; Displayed value - select Count distinct. -
Select Save to apply.
- Now, when you hover over the country you want to see, you can see the number of customers in each country.