Create Pivot Table
Add Pivot Table
-
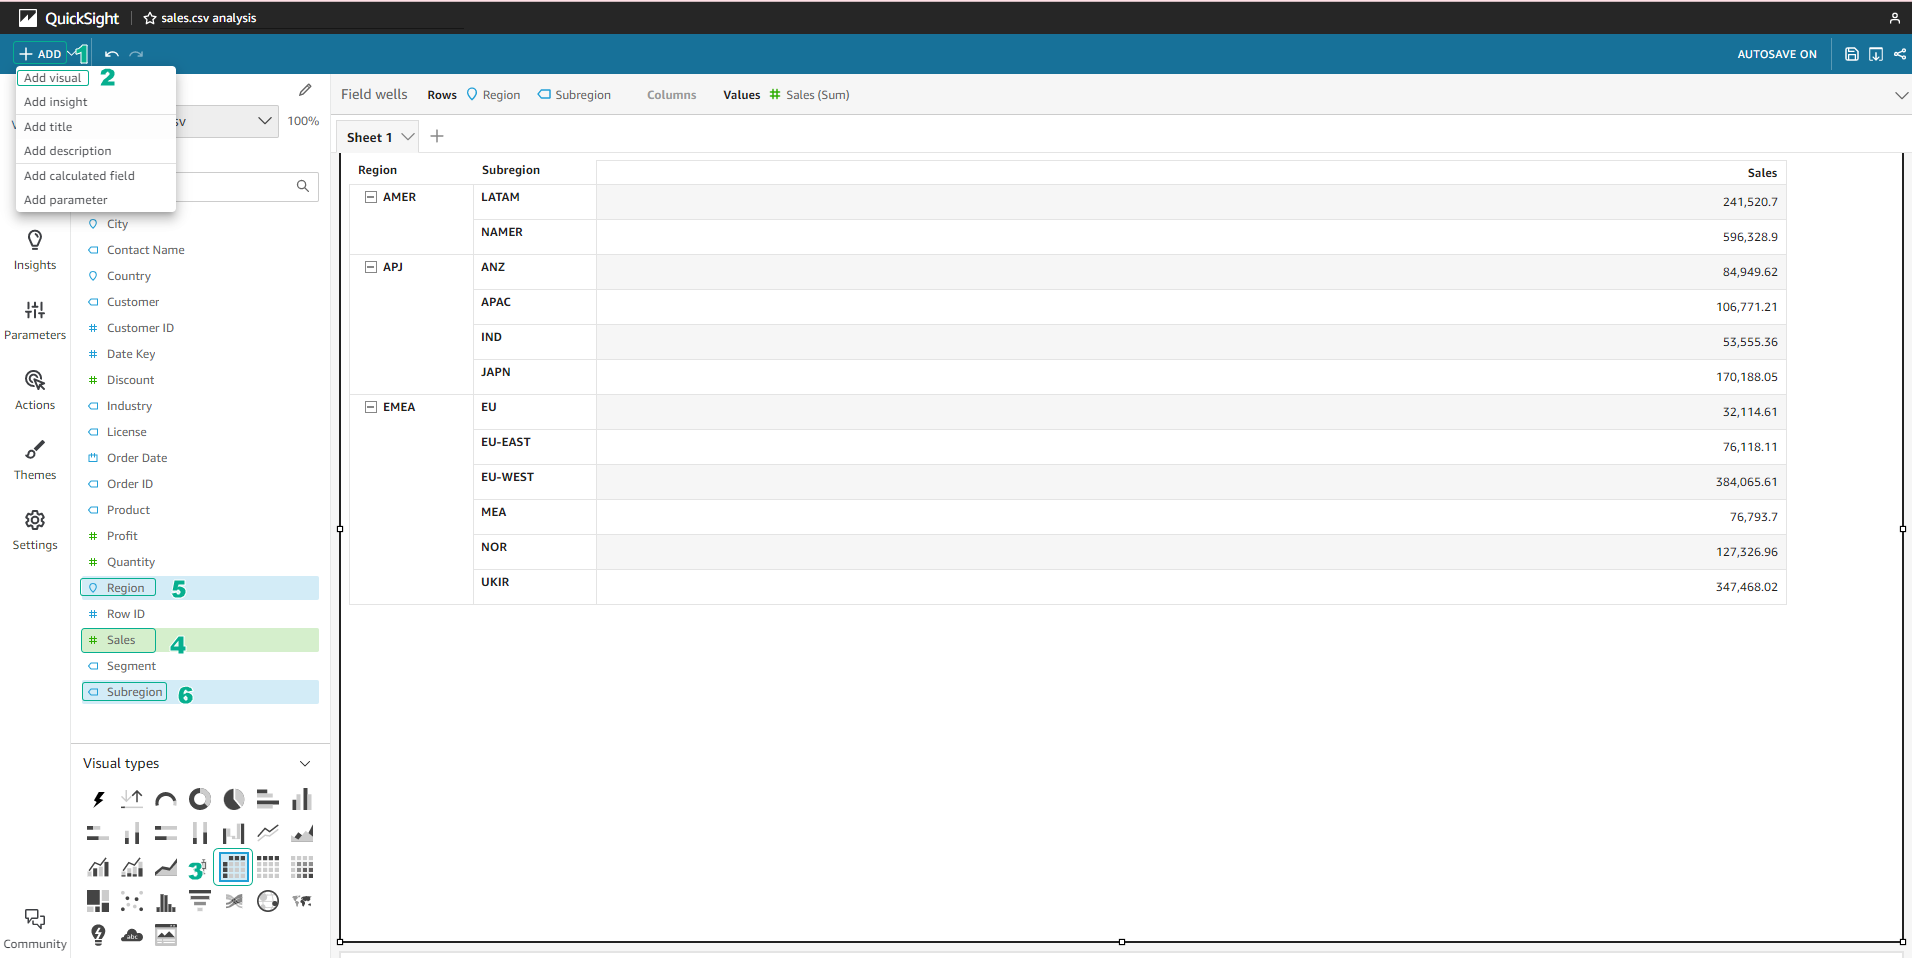
In the left corner, select Add > Add visual.
-
In the section Visual types in the lower left corner, select Pivot Table.
-
In the Fields list, select Sales, Region, and Subregion.
-
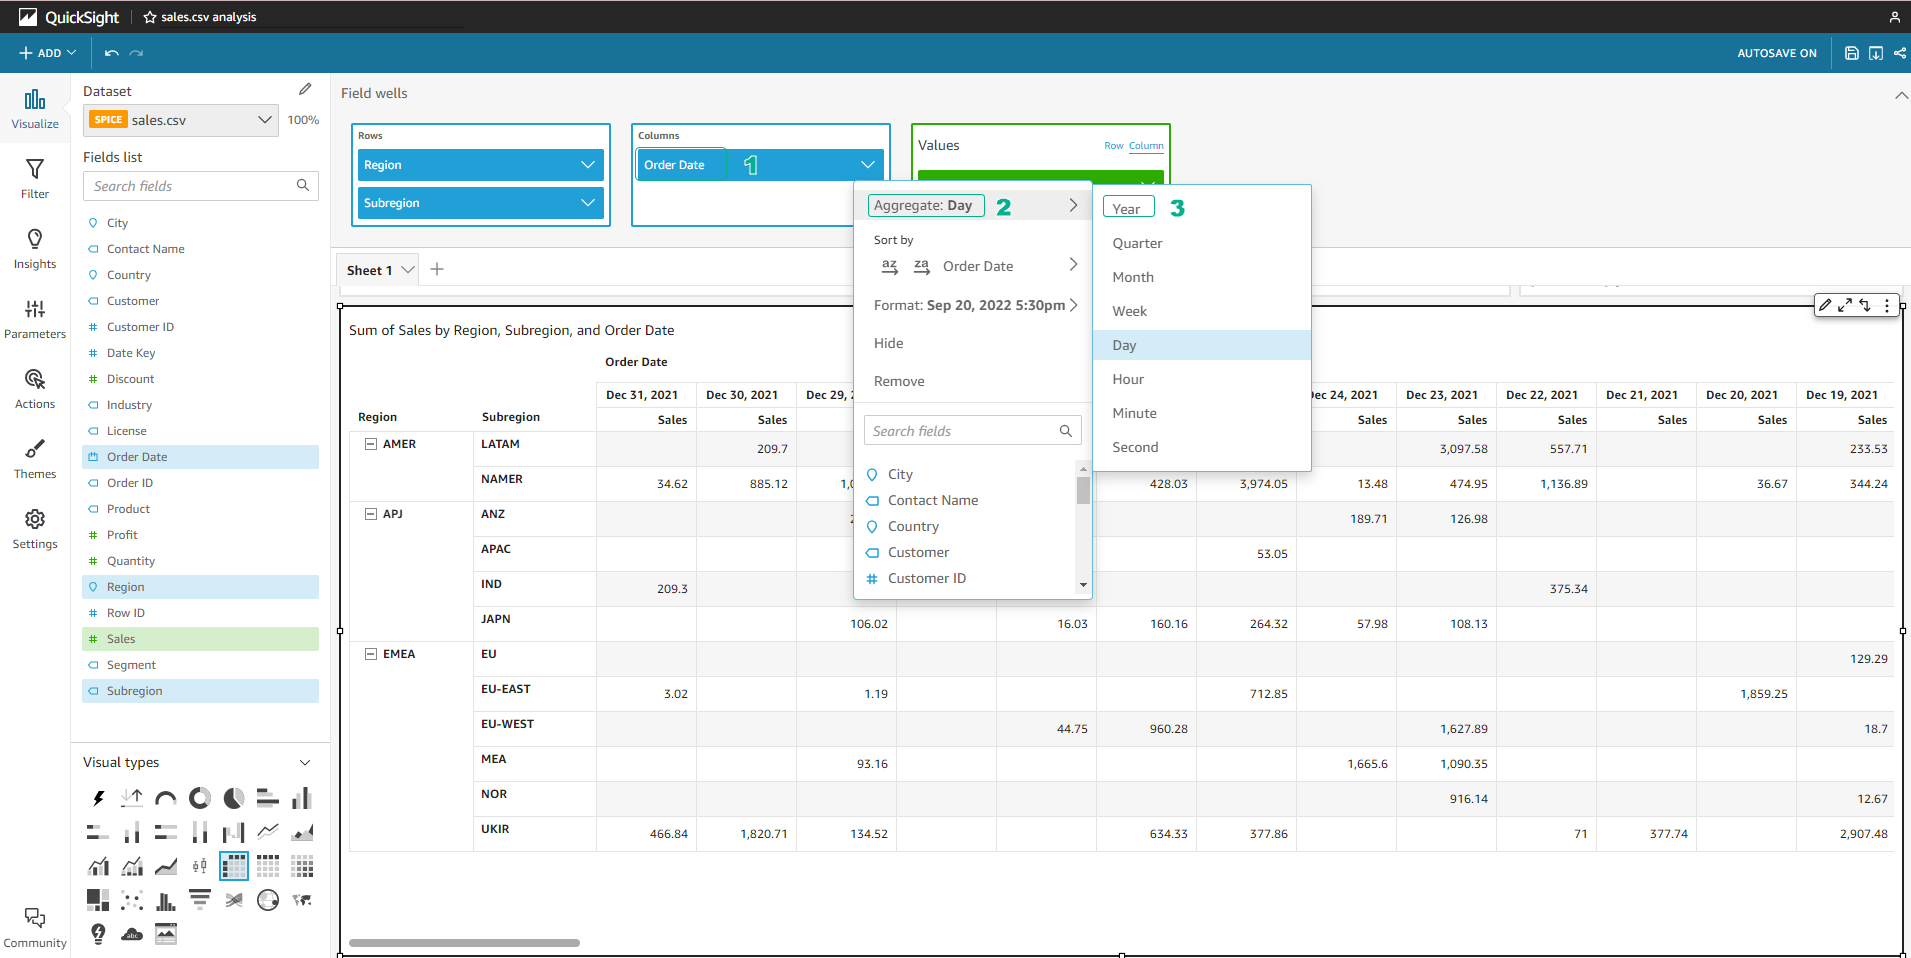
Drag and drop Order Date into the Columns section in the Field wells section.
-
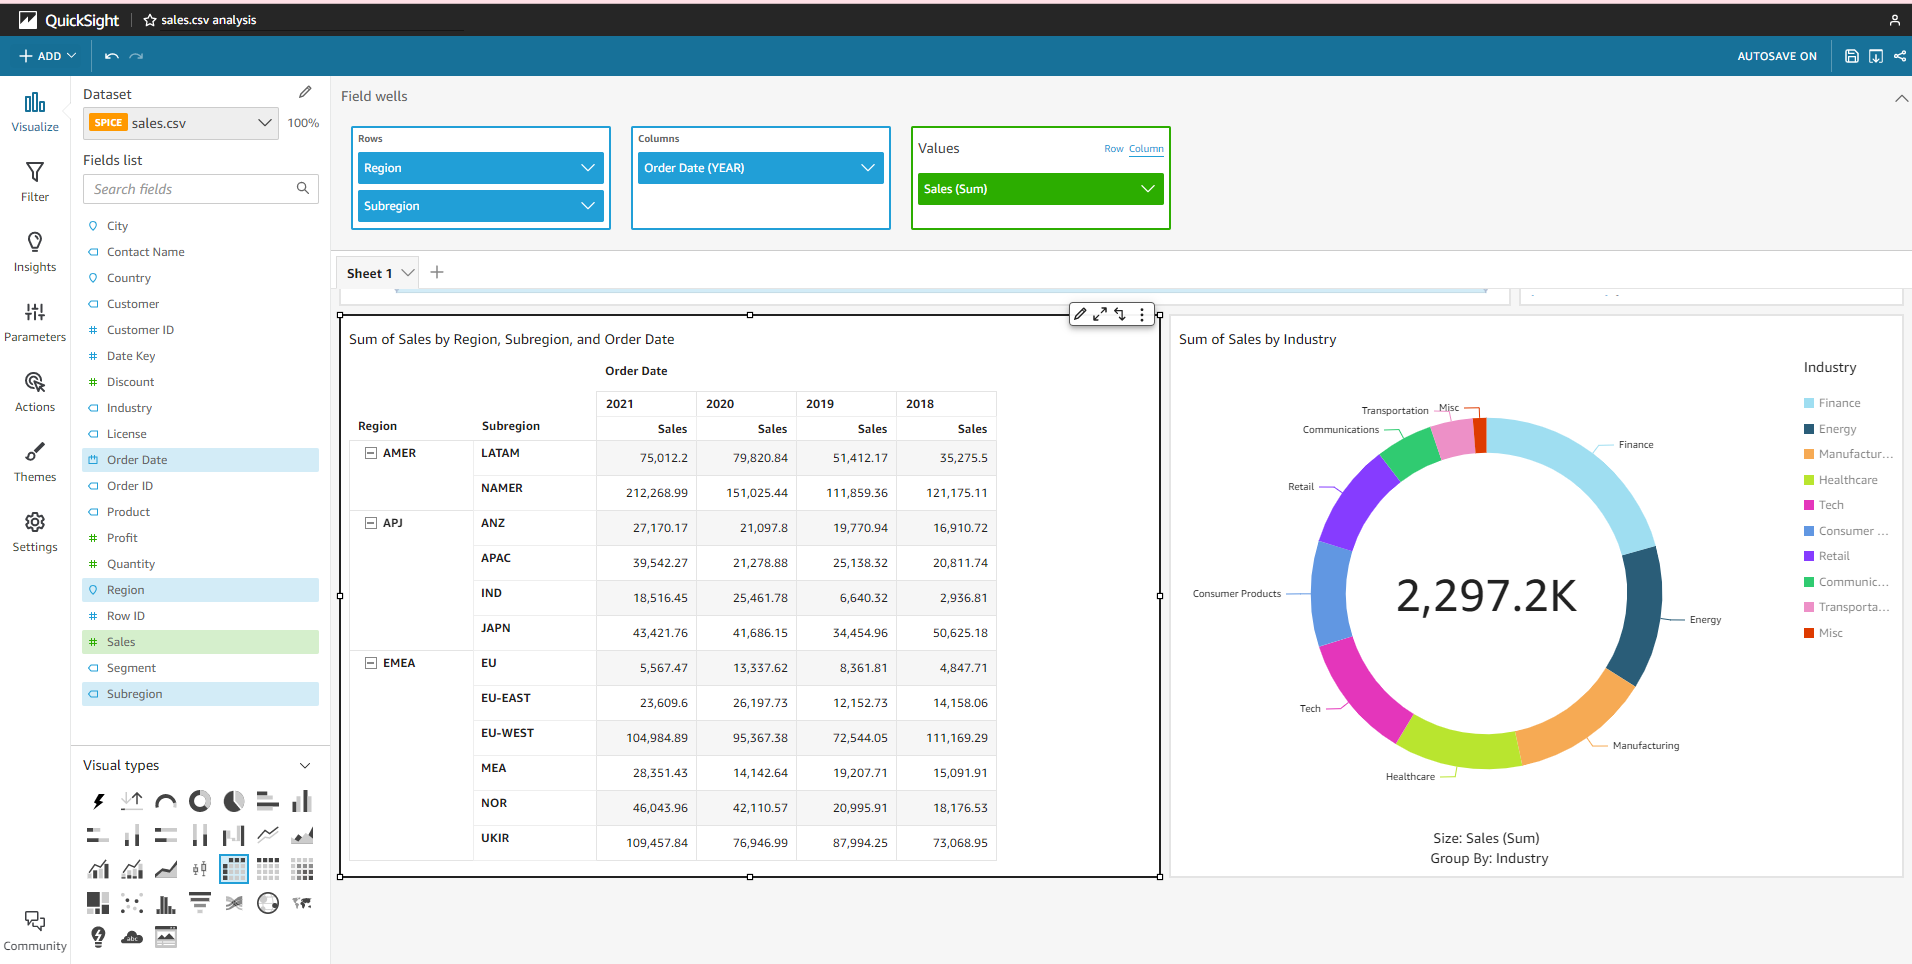
Select the Order Date item arrow in the Field wells section. Select Aggregate:Day > Year. Pivot Table will now be divided by year.
-
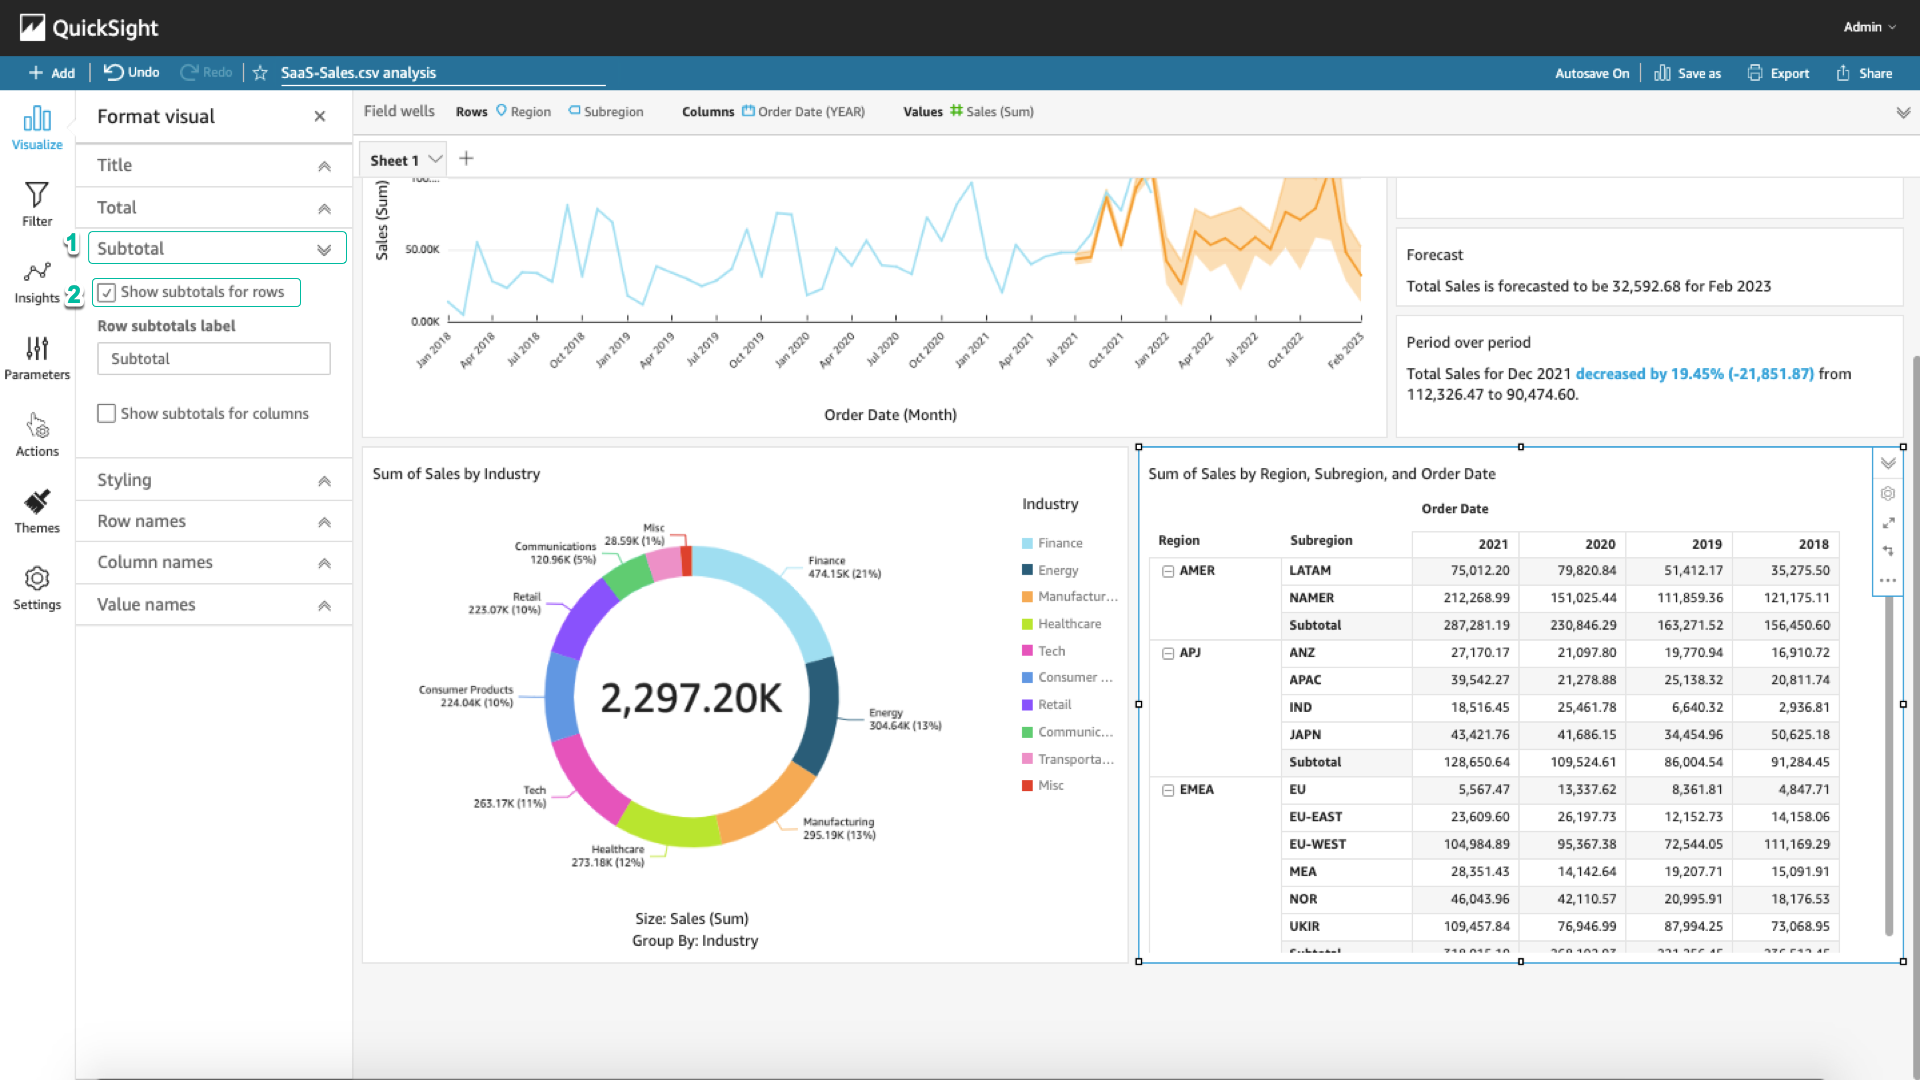
Select the gear icon in the right corner of the chart. Select Styling > Hide single metric so that the word Sale under each year disappears.
-
Select the item Subtotal > Show subtotals for rows. At this point, the Pivot Table will have totals by year and region.