KPI and Insights
Content
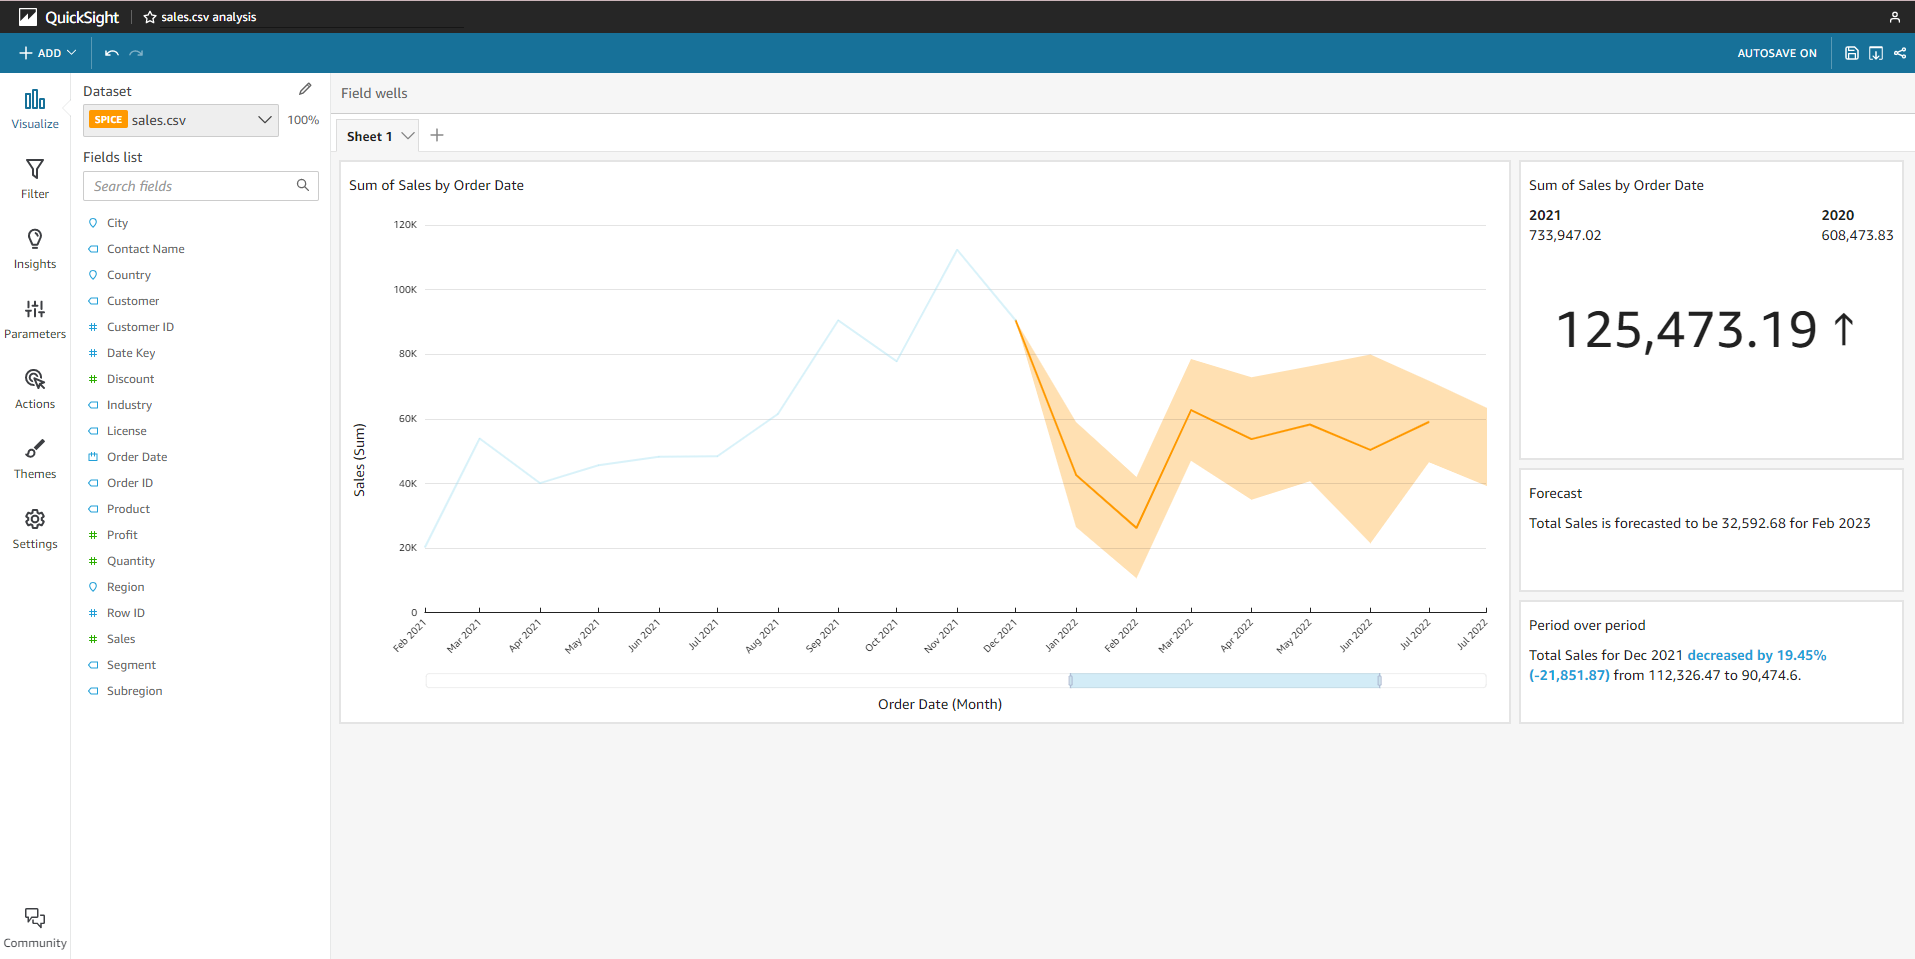
KPI chart
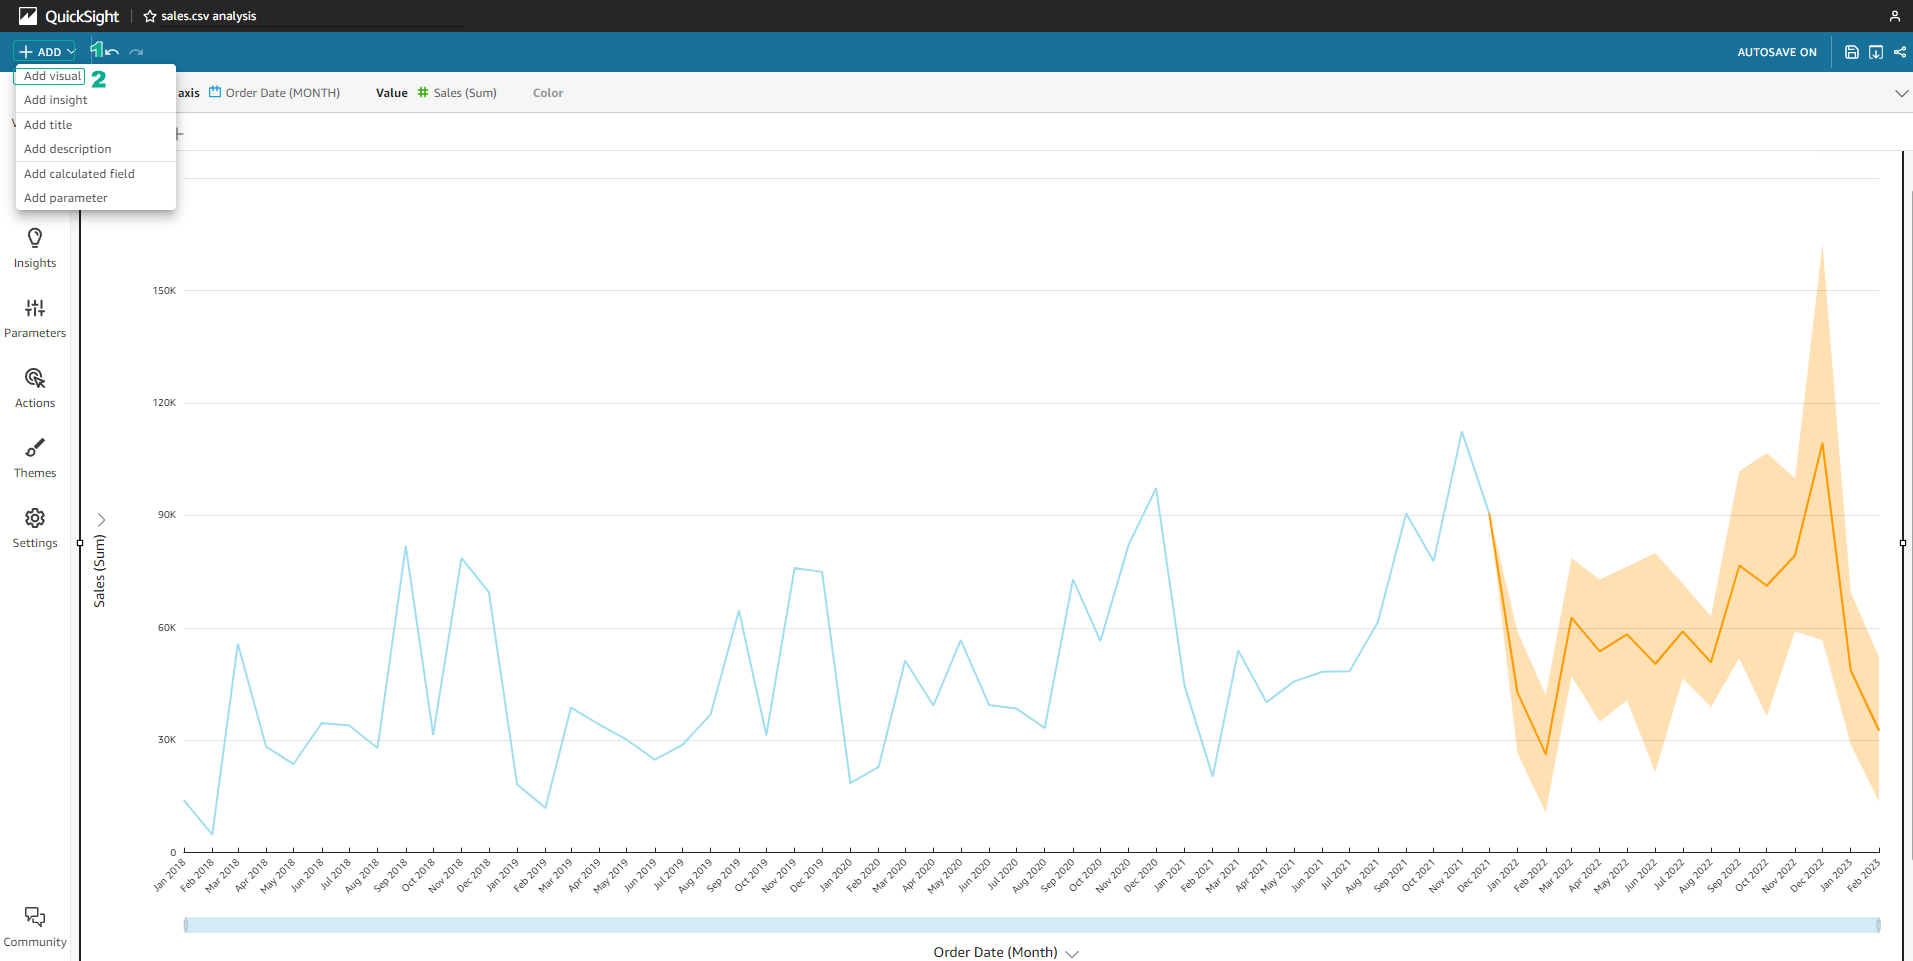
- To add a new chart, select Add > Add visual.
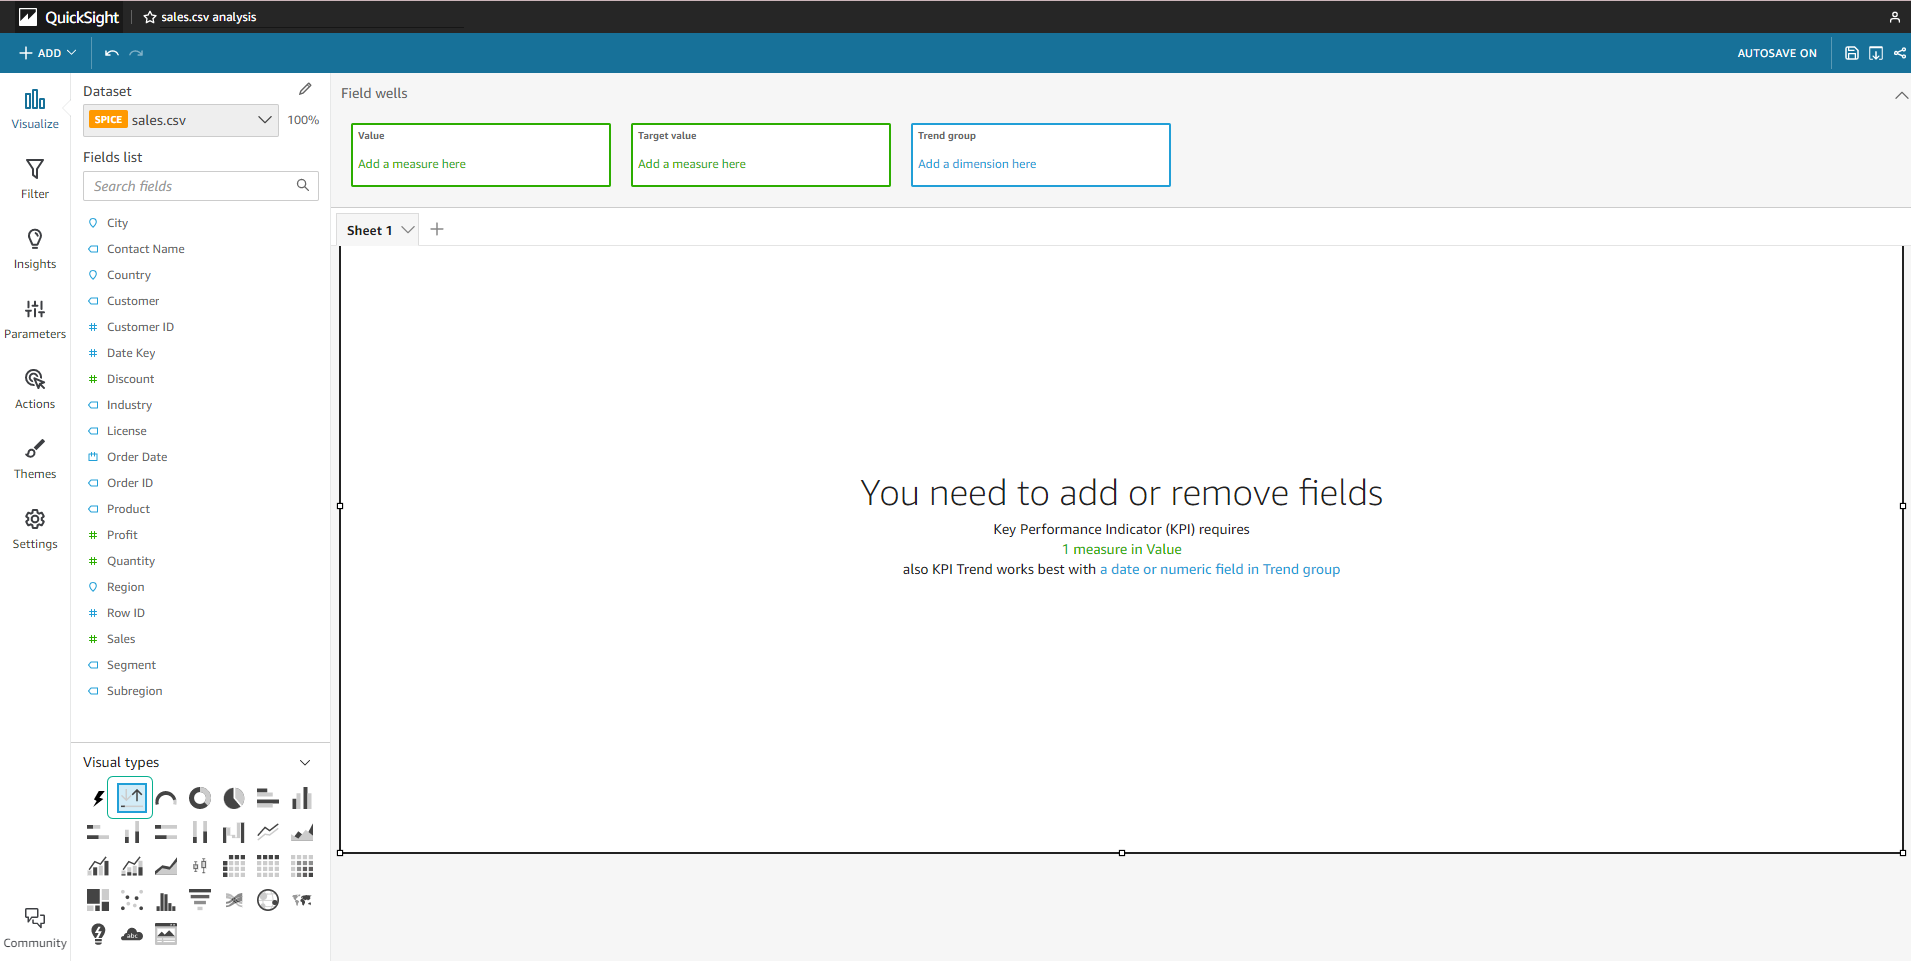
- In the bottom corner of the screen, change the Visual types to Key Performance Indicator (KPI).
-
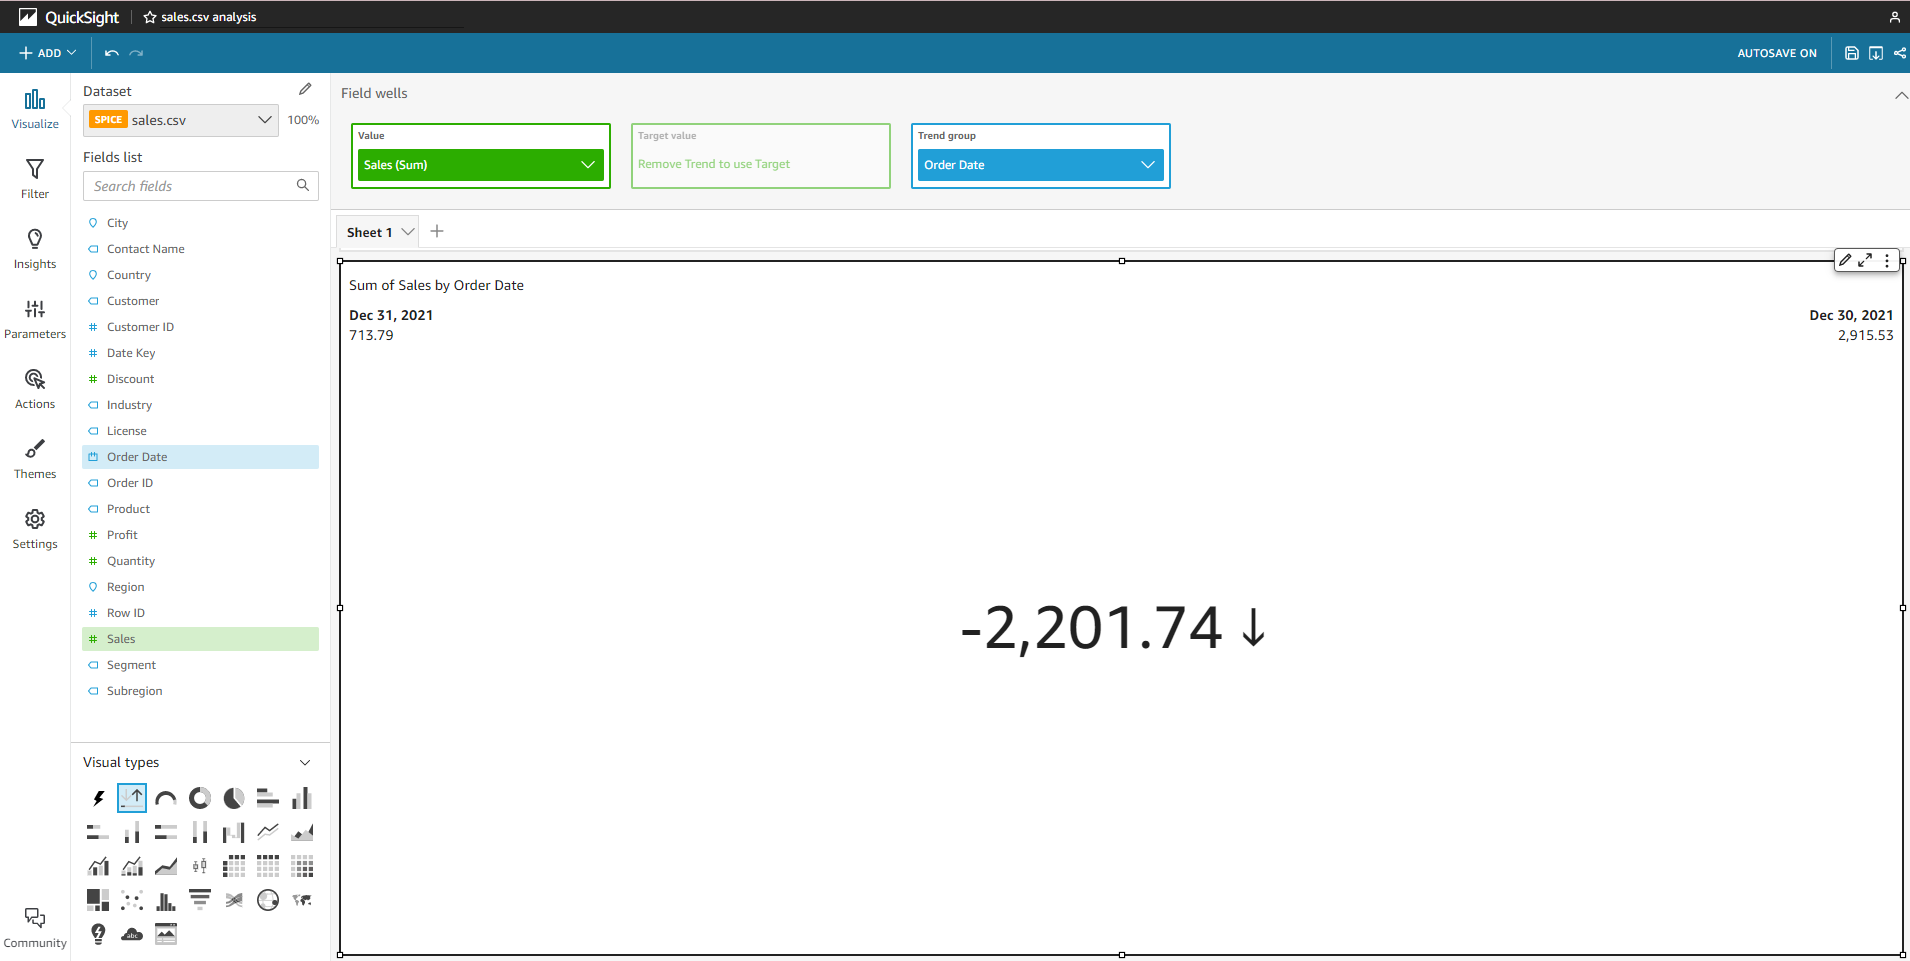
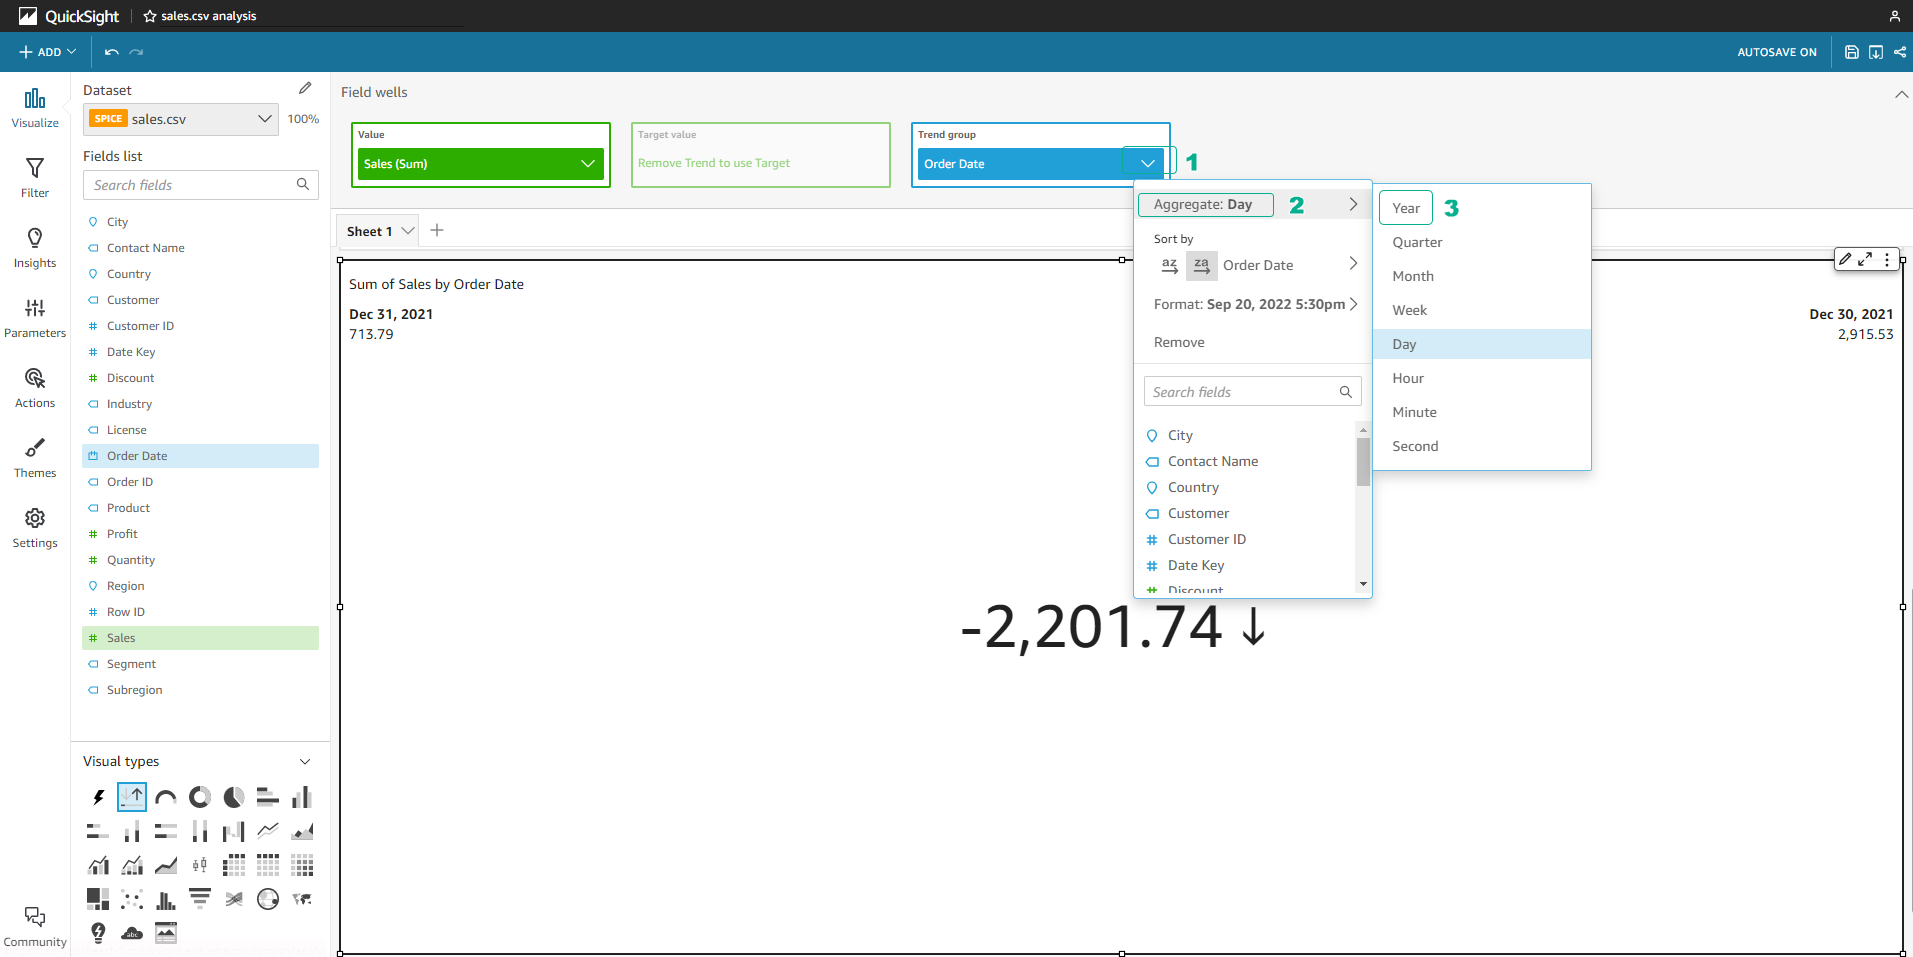
In the Fields list, select Sales and Order Date.
-
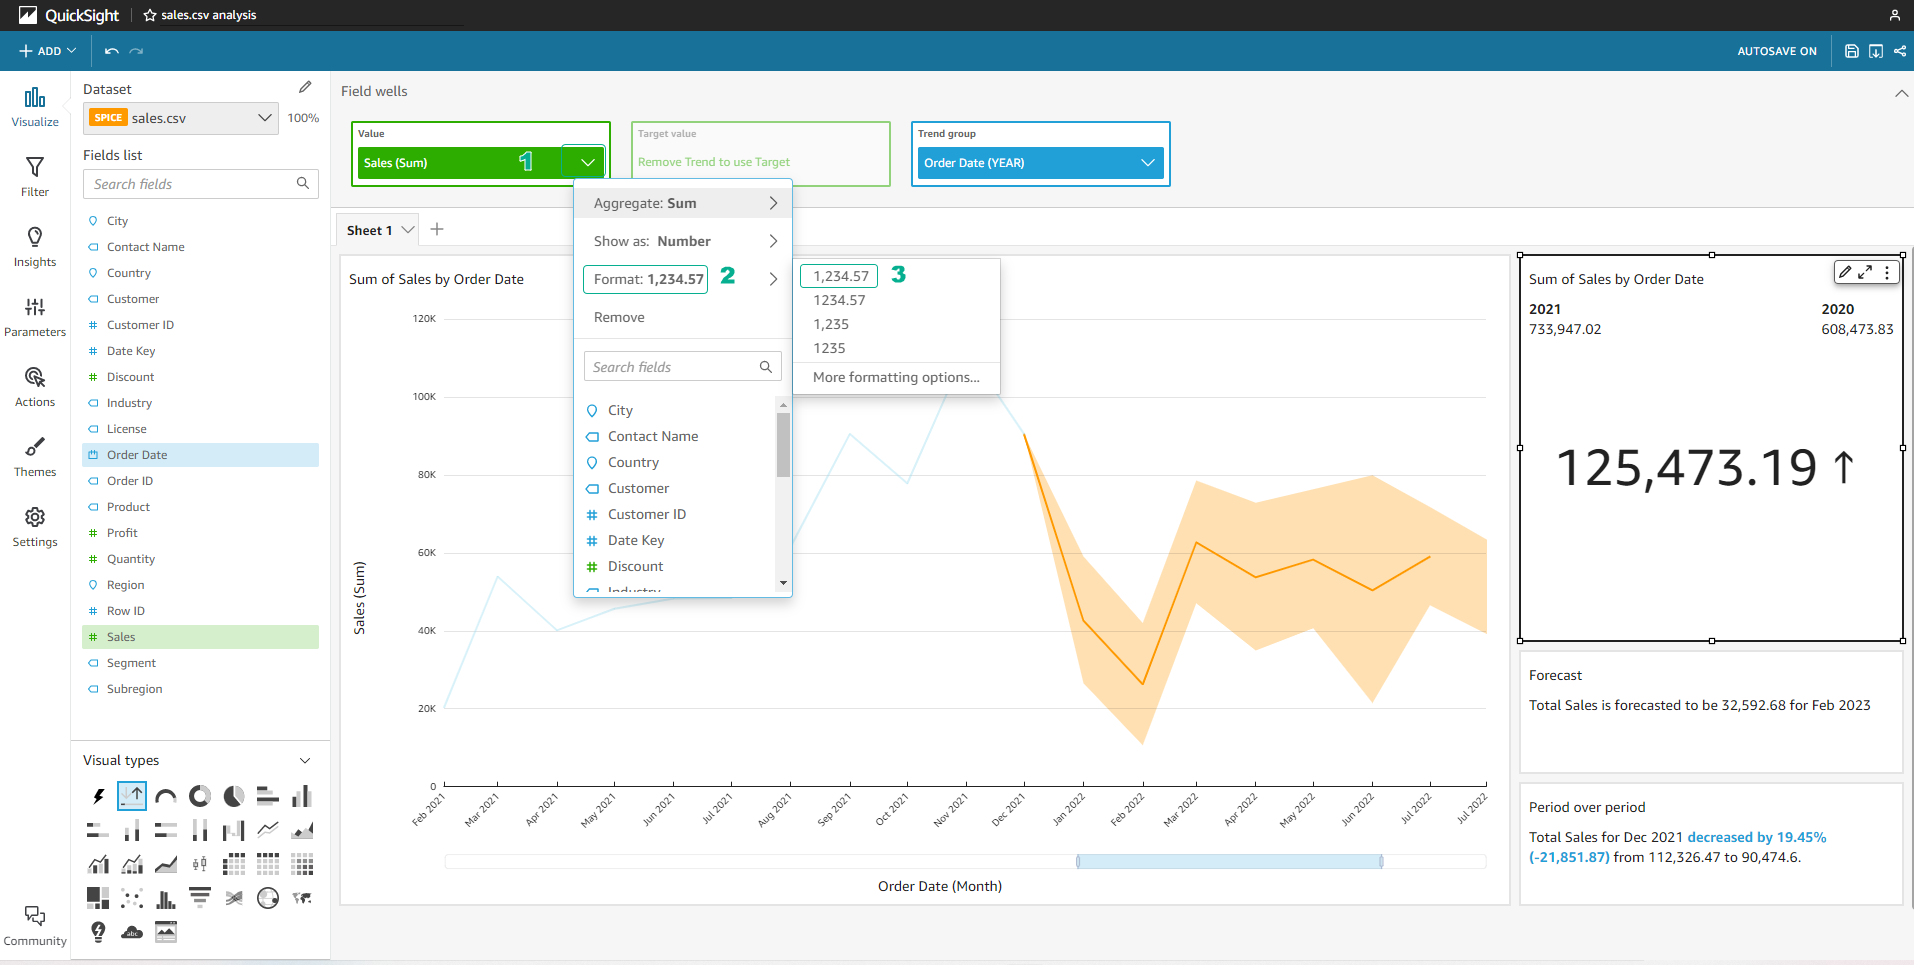
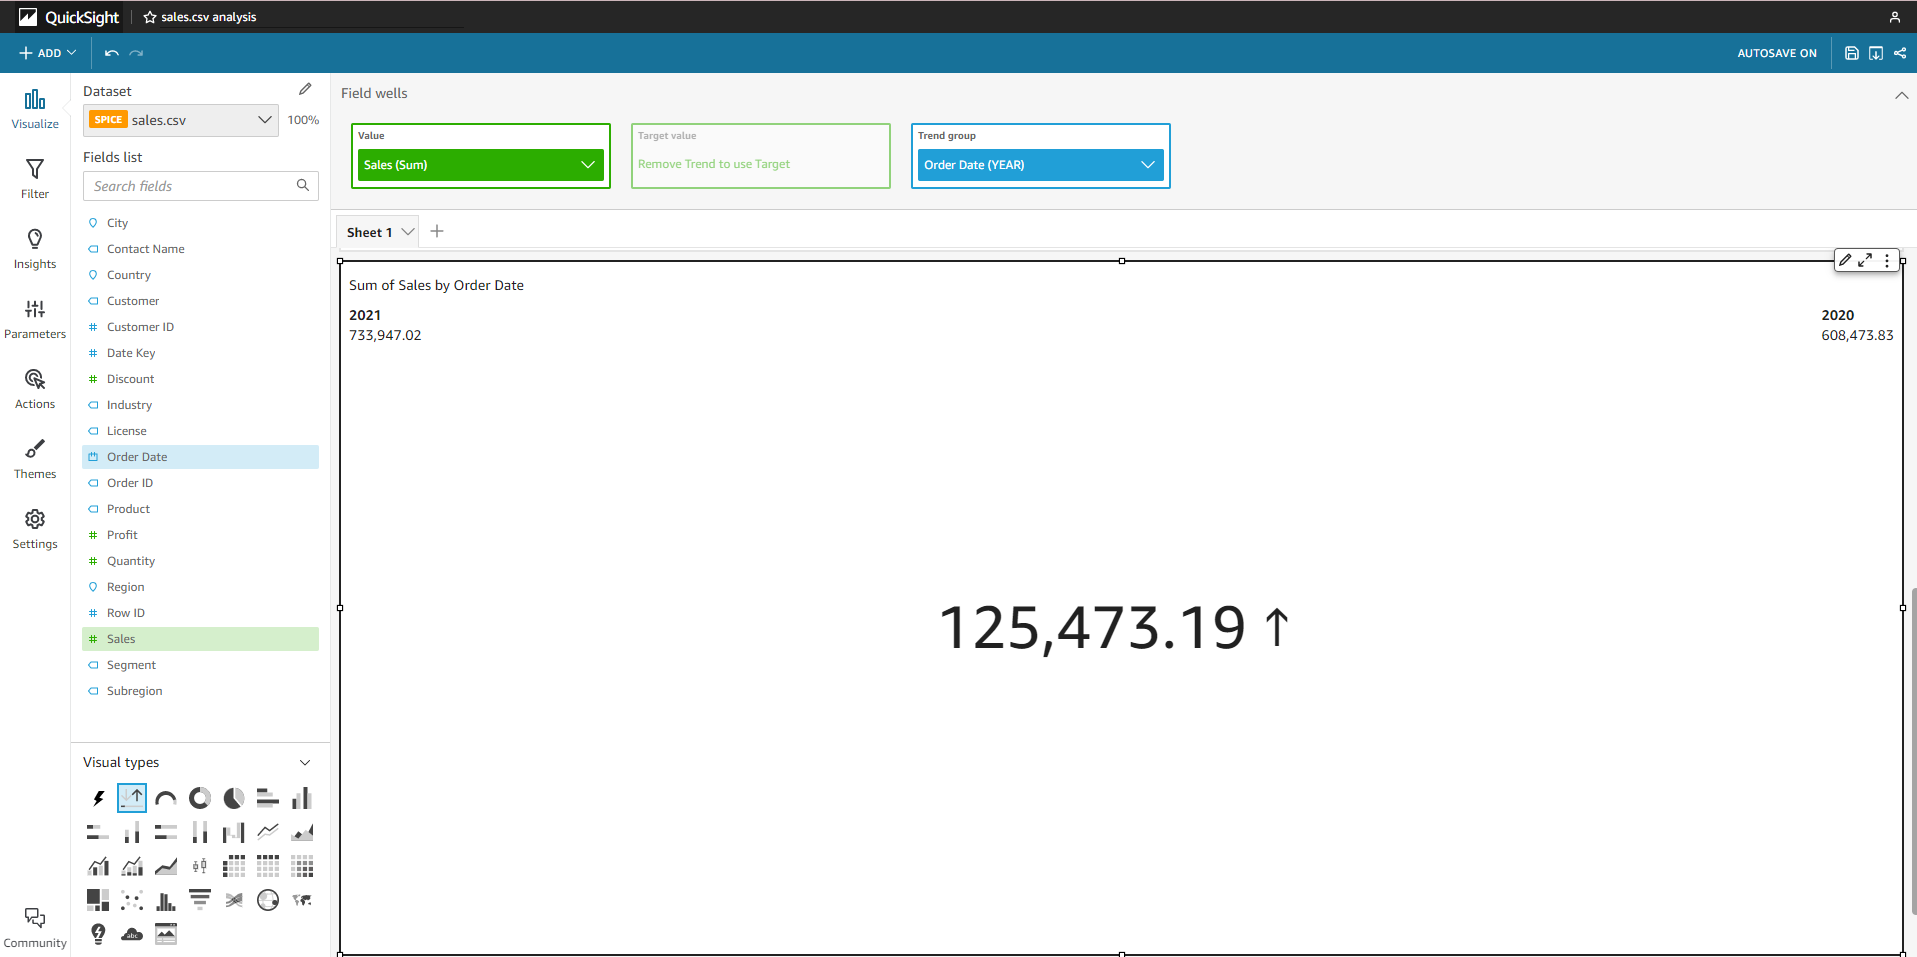
In the Field wells section, select the arrow at Order Date > Aggregate: Day > Year to change the comparison time based on each year.
- Hover the mouse on the small square icon below the chart, left-click and drag up to reduce the chart size.
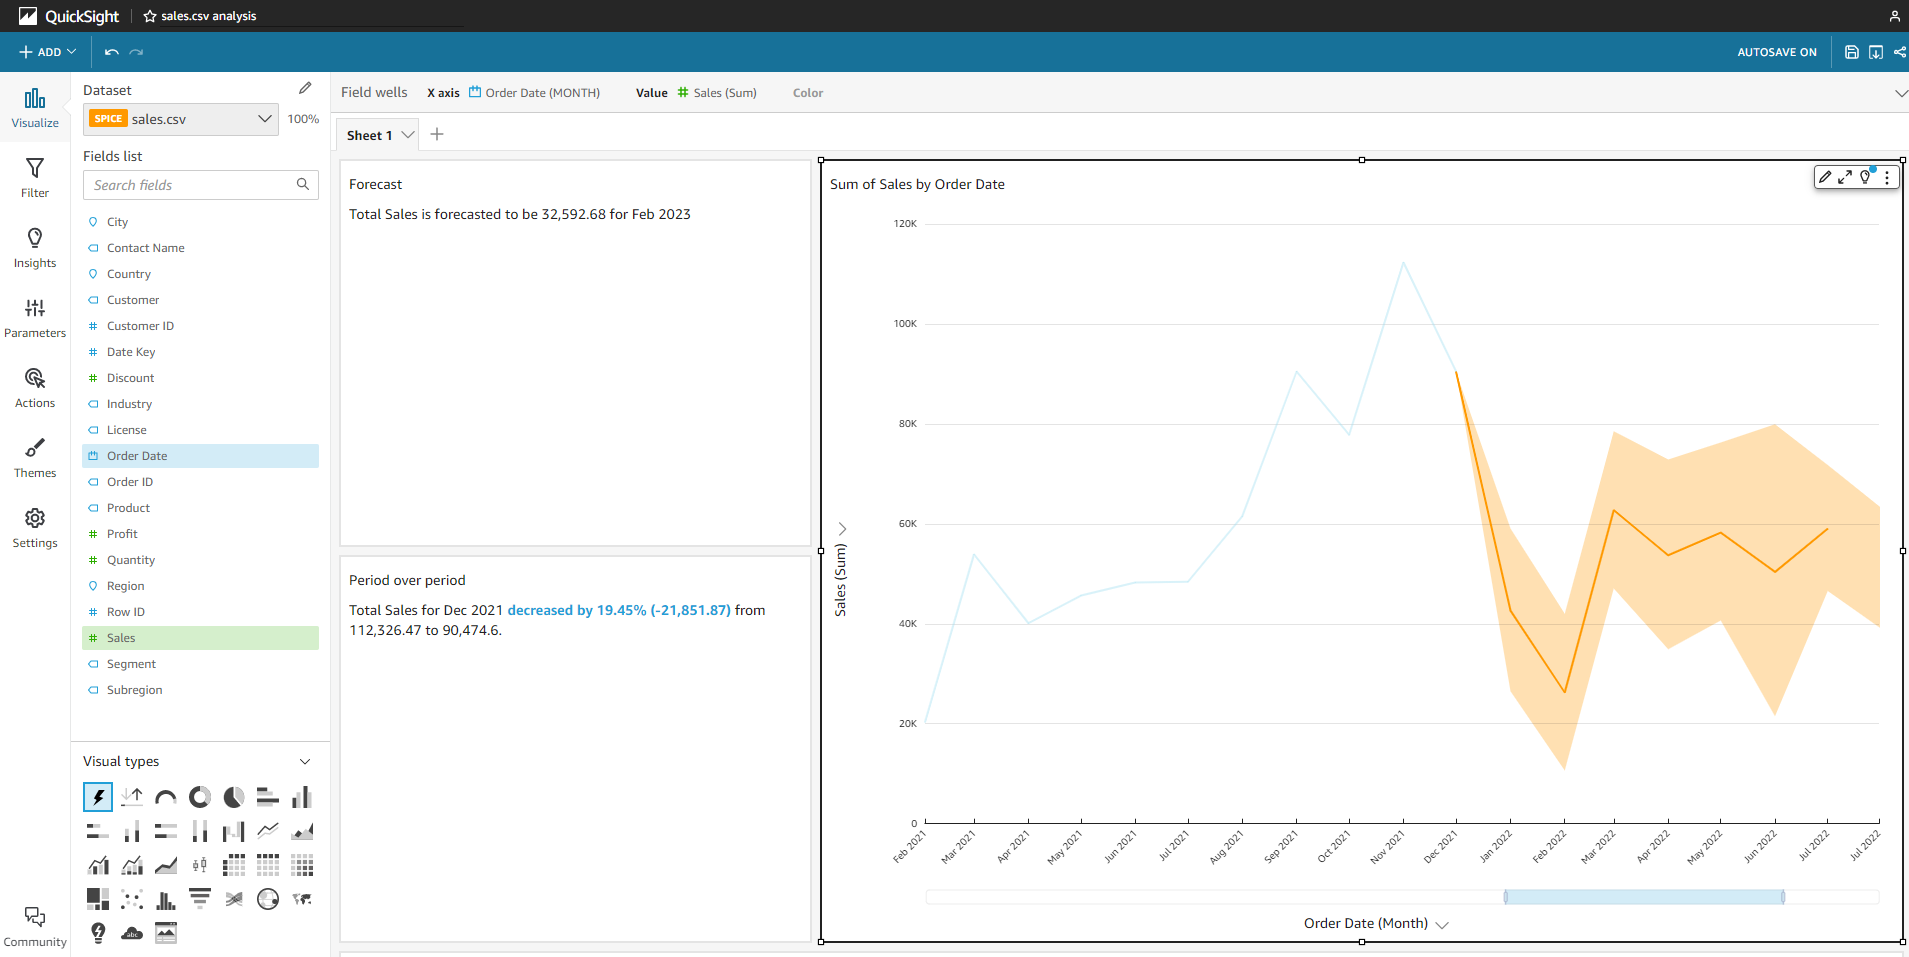
Useful insights
QuickSight provides self-generating insights thanks to QuickSight’s Machine learning technology. The results are based on the data in the dataset.
- Make sure the KPI chart is in the active state (with a green border around it), you can click inside the chart to switch to the active state for that chart.
- In the left navigation bar, Click Insights.

- Move the mouse to the position as shown below, and the + icon will appear.
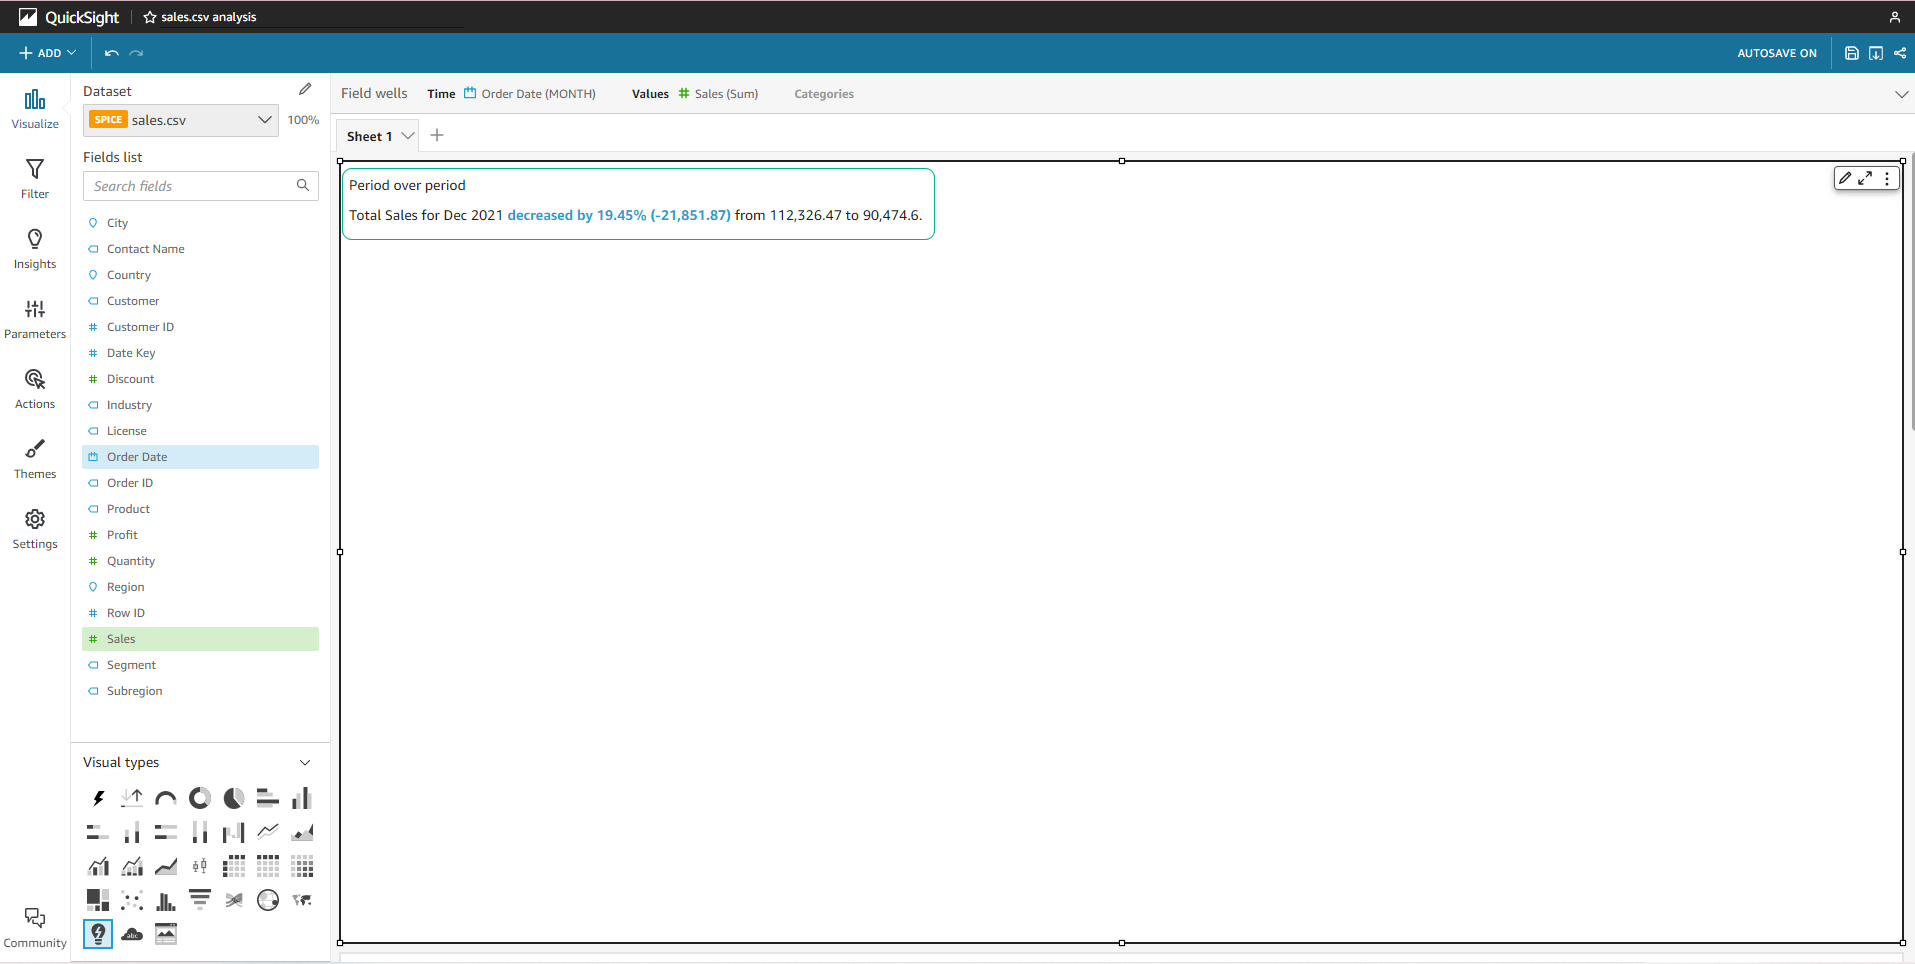
- Click + in the right corner of Insights MONTH OVER MONTH.
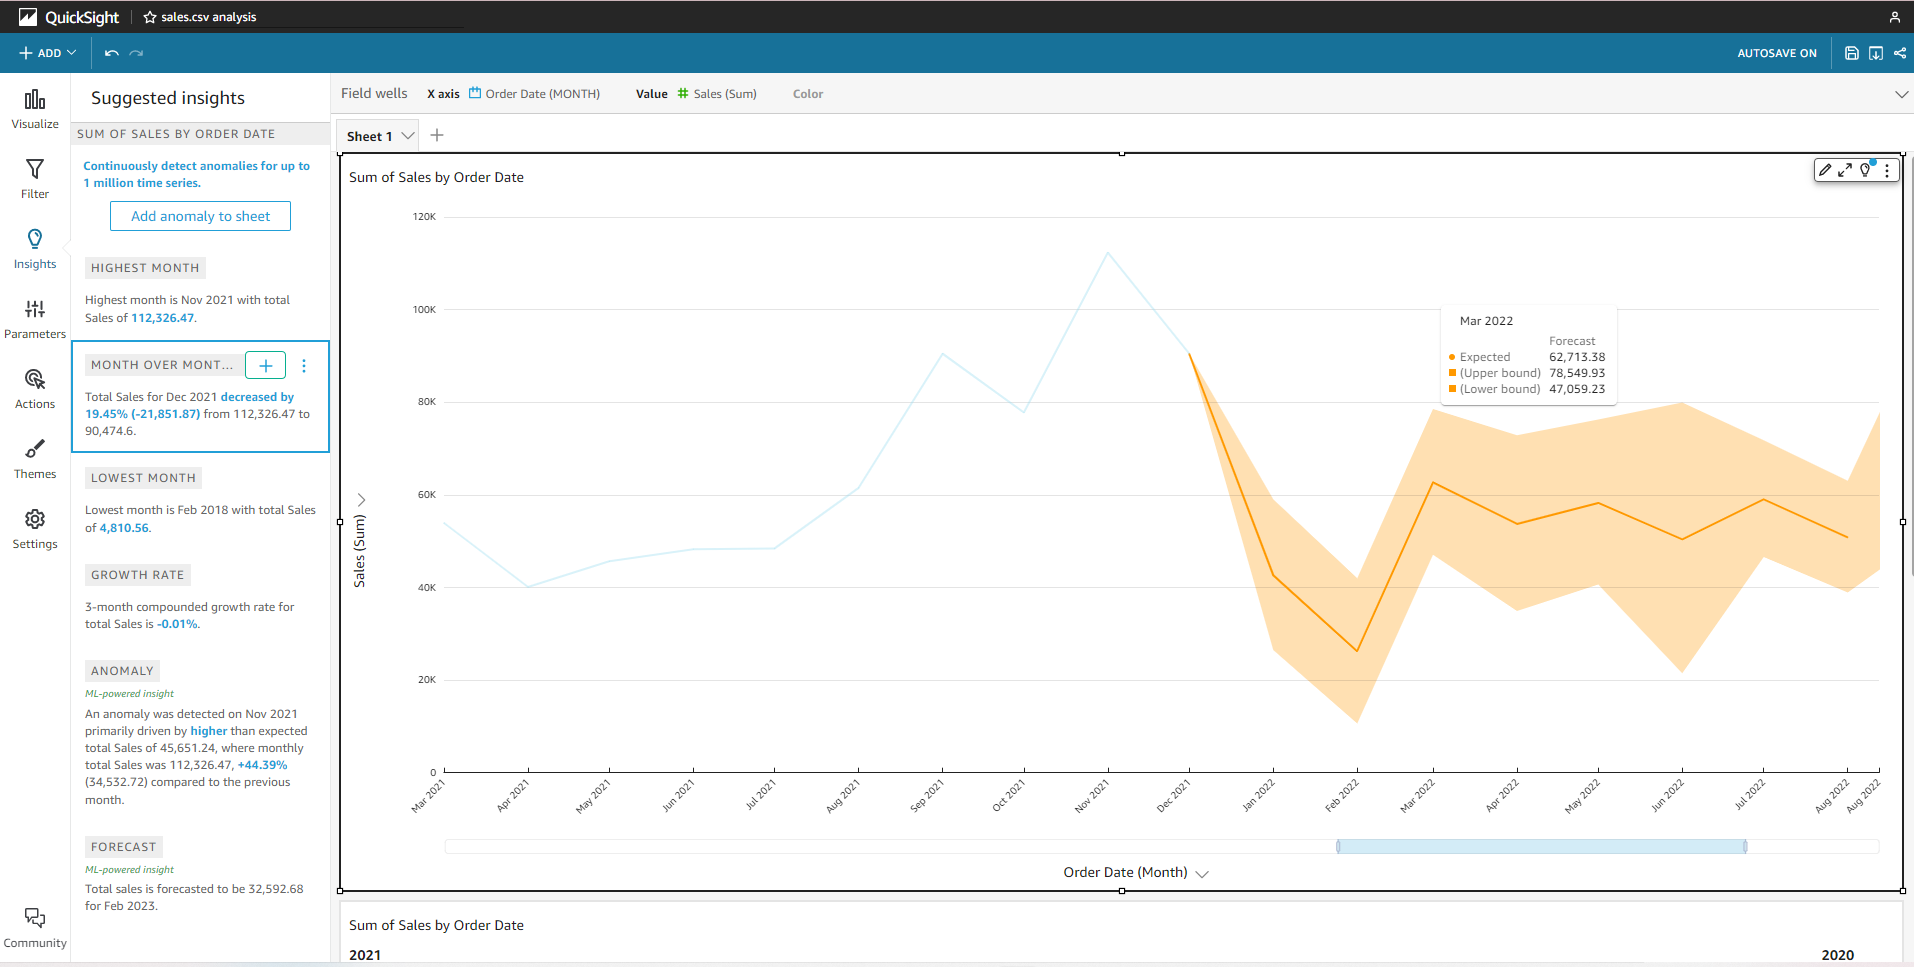
- Insight information is shown in a new chart.
- Do the same to add Insight Forecast.

- Insight information is shown in a new chart.
- Resize the chart to fit the dashboard.
- You can move the chart position by clicking on the chart border and dragging the mouse to move the chart to the desired position.
- You can collect calls if your data is too long. In the Field wells section, select the arrow in Sales > Format > select the appropriate format (eg 1,234.57).